.
.
Legal Acts
Documents
Electoral Bodies
Election Committees and Candidates
Turnout
Results
Statistical Data
SENATE
Created by
.
.
Voting Results
.
.
.
Voting Results for Committee
.
.
.
.
.
.
.
.
.
.
.
.
.
.
.
.
.
.
.
.
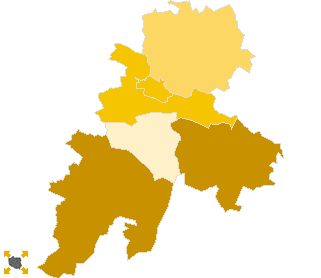
Polska
/
Opole
/
brzeski, pow.
...
Komitet Wyborczy Liga Polskich Rodzin
List's Number:
3
No. of valid votes:
35112
No. of votes per List:
525
1.50%
lack
1.03%
1.10%
1.17%
1.24%
1.31%
1.38%
1.45%
1.52%
1.59%
1.66%
not
of data
1.09%
1.16%
1.23%
1.30%
1.37%
1.44%
1.51%
1.58%
1.65%
1.73%
applicable
See also:
Turnout
Votes per Lists
Votes per Candidates
Information about Election Committee
Election results
Voting Results by location of ward electoral commission
.
.
Voting Results for Committee.
.
.
.
.
.
.
.
.
.
.
.
.
.
.
.
.
.
No.
Name
No. of entitled
to vote
No. of ballot papers
issued
No. of votes
No. of votes: per list / valid [%]
total
valid
per List
160101
Brzeg, m.
31103
16737
16732
16502
243
1.47
160103
Grodków, gm.
15705
6734
6734
6566
108
1.64
160104
Lewin Brzeski, gm.
10462
4831
4828
4688
77
1.64
160105
Lubsza, gm.
6979
3060
3060
2946
39
1.32
160106
Olszanka, gm.
3886
1869
1869
1831
19
1.04
160102
Skarbimierz, gm.
5318
2655
2655
2579
39
1.51
brzeski, pow.
73453
35886
35878
35112
525
1.50
.
.
Voting Results for Candidates
.
.
.
.
.
.
.
.
.
.
.
.
.
.
.
No.
Surname Names
No. of votes
% No. of votes per candidate/No. per list
% No. of votes per candidate/No. of valid votes
1
KAWA Marek
154
29.33
0.44
2
MAŁEK Mieczysław
39
7.42
0.11
3
PIASEK Bogumiła
34
6.47
0.10
4
GŁADYSZ Stanisław
16
3.04
0.05
5
SKAKUJ Stanisław
9
1.71
0.03
6
KONOPKA-WILCZEK Marzena
28
5.33
0.08
7
POMORSKI Wojciech Leszek
6
1.14
0.02
8
MOZGOWIEC Krzysztof
6
1.14
0.02
9
TYMKIEWICZ Iwona
22
4.19
0.06
10
RYBCZYŃSKI Mariusz Grzegorz
24
4.57
0.07
11
SUSKIEWICZ Tadeusz Jan
4
0.76
0.01
12
KUŚMIEREK Wiktor
2
0.38
0.01
13
SZYPUŁA Tomasz Paweł
22
4.19
0.06
14
WITCZAK Edwin Ireneusz
7
1.33
0.02
15
KURYŁO Władysław
4
0.76
0.01
16
OKRZESA Jerzy Władysław
7
1.33
0.02
17
MAGOT Bolesław Józef
4
0.76
0.01
18
ZALEWSKI Jacek
12
2.28
0.03
19
WARCHOŁ Krzysztof
11
2.09
0.03
20
CZAJKOWSKI Tomasz Leszek
11
2.09
0.03
21
MYSZAKOWSKA Justyna Paulina
11
2.09
0.03
22
SIETCZYŃSKI Adam Rafał
2
0.38
0.01
23
DROZDOWSKI Szczepan Przemysław
3
0.57
0.01
24
MICHALEWSKI Piotr
26
4.95
0.07
25
CZĄSTKIEWICZ Michał
2
0.38
0.01
26
ZWIERZCHOWSKI Eugeniusz
59
11.23
0.17
Σ
525
100.00
1.49
.
.
Voting Results by location of ward electoral commission.
.
.
.
.
.
.
.
.
.
.
.
.
.
.
.
.
.
No.
Name
No. of entitled
to vote
No. of ballot
papers issued
No. of votes
No. of votes: per list / valid [%]
total
valid
per List
1
City
44581
23457
23450
23085
356
1.54
2
Country
28872
12429
12428
12027
169
1.41
.
Voting Results by number of inhabitants of commune
.
1
to 5 000
3886
1869
1869
1831
19
1.04
2
from 5 001 to 10 000
12297
5715
5715
5525
78
1.41
3
from 10 001 to 20 000
26167
11565
11562
11254
185
1.64
4
from 20 001 to 50 000
31103
16737
16732
16502
243
1.47
5
from 50 001 to 100 000
0
0
0
0
0
0.00
6
from 100 001 to 200 000
0
0
0
0
0
0.00
7
from 200 001 to 500 000
0
0
0
0
0
0.00
8
over 500 000
0
0
0
0
0
0.00
Legal Acts
Documents
Electoral Bodies
Election Committees and Candidates
Turnout
Results
Statistical Data
SENATE
Created by
Copyright © 2007
Mikrobit Sp. z o.o.
. All Rights Reserved.
top