.
.
Legal Acts
Documents
Electoral Bodies
Election Committees and Candidates
Turnout
Results
Statistical Data
SENATE
Created by
.
.
Voting Results
.
.
.
Voting Results for Committee
.
.
.
.
.
.
.
.
.
.
.
.
.
.
.
.
.
.
.
.
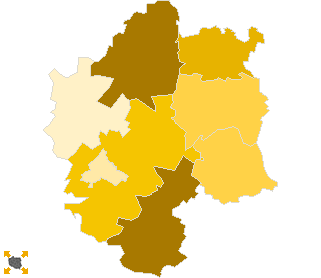
Polska
/
Wrocław
/
oleśnicki, pow.
...
Komitet Wyborczy Liga Polskich Rodzin
List's Number:
3
No. of valid votes:
39845
No. of votes per List:
399
1.00%
lack
0.61%
0.70%
0.79%
0.88%
0.97%
1.06%
1.15%
1.24%
1.33%
1.42%
not
of data
0.69%
0.78%
0.87%
0.96%
1.05%
1.14%
1.23%
1.32%
1.41%
1.51%
applicable
See also:
Turnout
Votes per Lists
Votes per Candidates
Information about Election Committee
Election results
Voting Results by location of ward electoral commission
.
.
Voting Results for Committee.
.
.
.
.
.
.
.
.
.
.
.
.
.
.
.
.
.
No.
Name
No. of entitled
to vote
No. of ballot papers
issued
No. of votes
No. of votes: per list / valid [%]
total
valid
per List
021402
Bierutów, gm.
8131
3561
3560
3458
50
1.45
021403
Dobroszyce, gm.
4717
2011
2011
1964
12
0.61
021404
Dziadowa Kłoda, gm.
3529
1358
1357
1317
14
1.06
021405
Międzybórz, gm.
3853
1712
1712
1678
22
1.31
021406
Oleśnica, gm.
8877
3547
3547
3469
40
1.15
021401
Oleśnica, m.
30103
17284
17265
17063
123
0.72
021407
Syców, gm.
12881
6546
6544
6392
70
1.10
021408
Twardogóra, gm.
10196
4597
4596
4504
68
1.51
oleśnicki, pow.
82287
40616
40592
39845
399
1.00
.
.
Voting Results for Candidates
.
.
.
.
.
.
.
.
.
.
.
.
.
.
.
No.
Surname Names
No. of votes
% No. of votes per candidate/No. per list
% No. of votes per candidate/No. of valid votes
1
DOBROSZ Janusz
96
24.06
0.24
2
BOJANOWSKI Maciej Rafał
75
18.79
0.19
3
PAŚKO Marek Lesław
12
3.00
0.03
4
CHMURZYŃSKI Piotr Michał
10
2.50
0.03
5
PARTYKA Ireneusz
15
3.75
0.04
6
ZIOMEK Jerzy Andrzej
17
4.26
0.04
7
WASZKIEWICZ Piotr Tadeusz
9
2.25
0.02
8
KAŹMIERCZAK Ryszard
18
4.51
0.05
9
PARDA Małgorzata
11
2.75
0.03
10
ZNAMIROWSKI Jacek
19
4.76
0.05
11
KRESA Mariusz
8
2.00
0.02
12
MARKOWSKI Marcin Łukasz
8
2.00
0.02
13
WOŁYNIAK Ireneusz Leszek
4
1.00
0.01
14
SPICH Anna Teresa
7
1.75
0.02
15
BORGOWSKI Roman
4
1.00
0.01
16
POSMYK Stanisław
5
1.25
0.01
17
KOŁAKOWSKI Tomasz
9
2.25
0.02
18
KOTAS Mateusz
9
2.25
0.02
19
JARZĄBEK Zbigniew
13
3.25
0.03
20
NOWAKOWSKI Henryk
5
1.25
0.01
21
IWASZKIEWICZ Robert Jarosław
11
2.75
0.03
22
WEDLER Małgorzata
6
1.50
0.02
23
RUDOWSKI Bohdan
3
0.75
0.01
24
BLICHARSKA Elżbieta
9
2.25
0.02
25
MAURER Robert Jarosław
1
0.25
0.00
26
GĄSIOROWSKI Cyprian
2
0.50
0.01
27
TOMCZYK Norbert
13
3.25
0.03
Σ
399
100.00
1.00
.
.
Voting Results by location of ward electoral commission.
.
.
.
.
.
.
.
.
.
.
.
.
.
.
.
.
.
No.
Name
No. of entitled
to vote
No. of ballot
papers issued
No. of votes
No. of votes: per list / valid [%]
total
valid
per List
1
City
50463
27805
27786
27382
256
0.93
2
Country
31824
12811
12806
12463
143
1.15
.
Voting Results by number of inhabitants of commune
.
1
to 5 000
3529
1358
1357
1317
14
1.06
2
from 5 001 to 10 000
8570
3723
3723
3642
34
0.93
3
from 10 001 to 20 000
40085
18251
18247
17823
228
1.28
4
from 20 001 to 50 000
30103
17284
17265
17063
123
0.72
5
from 50 001 to 100 000
0
0
0
0
0
0.00
6
from 100 001 to 200 000
0
0
0
0
0
0.00
7
from 200 001 to 500 000
0
0
0
0
0
0.00
8
over 500 000
0
0
0
0
0
0.00
Legal Acts
Documents
Electoral Bodies
Election Committees and Candidates
Turnout
Results
Statistical Data
SENATE
Created by
Copyright © 2007
Mikrobit Sp. z o.o.
. All Rights Reserved.
top