|
See also:
|
| . |
. |
Voting Results for Committee. |
. |
. |
| . |
. |
| . |
. |
. |
. |
. |
. |
. |
. |
. |
. |
. |
. |
. |
| No. |
Name |
No. of entitled
to vote |
No. of ballot papers
issued |
No. of votes |
No. of votes: per list / valid [%] |
| total |
valid |
per List |
| 140303 | Borowie, gm. | 3944 | 1814 | 1814 | 1755 | 13 | 0.74 |  |
| 140304 | Garwolin, gm. | 9128 | 4693 | 4690 | 4595 | 35 | 0.76 | |
| 140301 | Garwolin, m. | 13004 | 8053 | 8054 | 7916 | 43 | 0.54 | |
| 140305 | Górzno, gm. | 4682 | 2373 | 2373 | 2324 | 18 | 0.77 | |
| 140306 | Łaskarzew, gm. | 4055 | 1939 | 1939 | 1894 | 17 | 0.90 | |
| 140302 | Łaskarzew, m. | 3843 | 2022 | 2022 | 1966 | 20 | 1.02 | |
| 140307 | Maciejowice, gm. | 5882 | 2651 | 2651 | 2555 | 29 | 1.14 | |
| 140308 | Miastków Kościelny, gm. | 4013 | 1941 | 1940 | 1892 | 15 | 0.79 | |
| 140309 | Parysów, gm. | 3109 | 1427 | 1427 | 1343 | 8 | 0.60 | |
| 140310 | Pilawa, gm. | 8149 | 4106 | 4104 | 4009 | 37 | 0.92 | |
| 140311 | Sobolew, gm. | 6352 | 3088 | 3087 | 3020 | 31 | 1.03 | |
| 140312 | Trojanów, gm. | 6071 | 2879 | 2878 | 2811 | 36 | 1.28 | |
| 140313 | Wilga, gm. | 4107 | 2034 | 2033 | 1981 | 12 | 0.61 | |
| 140314 | Żelechów, gm. | 6601 | 3283 | 3283 | 3181 | 18 | 0.57 | |
| |
garwoliński, pow. |
82940 |
42303 |
42295 |
41242 |
332 |
0.81 |
 |
|
| |
| . |
. |
Voting Results by location of ward electoral commission. |
. |
. |
| . |
. |
| . |
. |
. |
. |
. |
. |
. |
. |
. |
. |
. |
. |
. |
| No. |
Name |
No. of entitled
to vote |
No. of ballot
papers issued |
No. of votes |
No. of votes: per list / valid [%] |
| total |
valid |
per List |
| 1 | City | 24489 | 14161 | 14160 | 13867 | 87 | 0.63 | |
| 2 | Country | 58451 | 28142 | 28135 | 27375 | 245 | 0.89 | |
| . |
Voting Results by number of inhabitants of commune |
. |
| 1 | to 5 000 | 6952 | 3449 | 3449 | 3309 | 28 | 0.85 | |
| 2 | from 5 001 to 10 000 | 45707 | 22002 | 21998 | 21413 | 189 | 0.88 | |
| 3 | from 10 001 to 20 000 | 30281 | 16852 | 16848 | 16520 | 115 | 0.70 | |
| 4 | from 20 001 to 50 000 | 0 | 0 | 0 | 0 | 0 | 0.00 | |
| 5 | from 50 001 to 100 000 | 0 | 0 | 0 | 0 | 0 | 0.00 | |
| 6 | from 100 001 to 200 000 | 0 | 0 | 0 | 0 | 0 | 0.00 | |
| 7 | from 200 001 to 500 000 | 0 | 0 | 0 | 0 | 0 | 0.00 | |
| 8 | over 500 000 | 0 | 0 | 0 | 0 | 0 | 0.00 | |
|
|


 Legal Acts
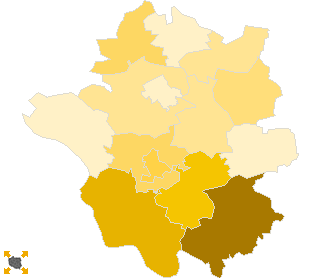
 Legal Acts