.
.
Legal Acts
Documents
Electoral Bodies
Election Committees and Candidates
Turnout
Results
Statistical Data
SENATE
Created by
.
.
Voting Results
.
.
.
Voting Results for Committee
.
.
.
.
.
.
.
.
.
.
.
.
.
.
.
.
.
.
.
.
Polska
/
Kielce
/
włoszczowski, pow.
...
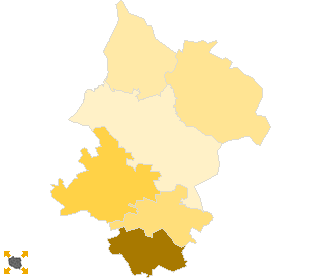
Komitet Wyborczy Samoobrona Rzeczpospolitej Polskiej
List's Number:
15
No. of valid votes:
16686
No. of votes per List:
272
1.63%
lack
0.98%
1.32%
1.66%
2.00%
2.34%
2.68%
3.02%
3.36%
3.70%
4.04%
not
of data
1.31%
1.65%
1.99%
2.33%
2.67%
3.01%
3.35%
3.69%
4.03%
4.38%
applicable
See also:
Turnout
Votes per Lists
Votes per Candidates
Information about Election Committee
Election results
Voting Results by location of ward electoral commission
.
.
Voting Results for Committee.
.
.
.
.
.
.
.
.
.
.
.
.
.
.
.
.
.
No.
Name
No. of entitled
to vote
No. of ballot papers
issued
No. of votes
No. of votes: per list / valid [%]
total
valid
per List
261301
Kluczewsko, gm.
4135
1842
1842
1768
24
1.36
261302
Krasocin, gm.
8417
3669
3667
3565
63
1.77
261303
Moskorzew, gm.
2435
1201
1201
1150
50
4.35
261304
Radków, gm.
2202
743
743
722
15
2.08
261305
Secemin, gm.
4176
1541
1541
1491
41
2.75
261306
Włoszczowa, gm.
16471
8244
8226
7990
79
0.99
włoszczowski, pow.
37836
17240
17220
16686
272
1.63
.
.
Voting Results for Candidates
.
.
.
.
.
.
.
.
.
.
.
.
.
.
.
No.
Surname Names
No. of votes
% No. of votes per candidate/No. per list
% No. of votes per candidate/No. of valid votes
1
OLEJNIK Małgorzata Dorota
79
29.04
0.47
2
GROSS Norbert Krzysztof
15
5.51
0.09
3
ADAMCZAK Józef
17
6.25
0.10
4
BĄK Józef Stanisław
11
4.04
0.07
5
DYRAGA Kazimierz
6
2.20
0.04
6
CHYC Kazimierz Józef
15
5.51
0.09
7
PŁUSA Szymon Wacław
2
0.73
0.01
8
BURAS Janusz
1
0.36
0.01
9
CICHOŃ Roman
3
1.10
0.02
10
SAGAN Józef
5
1.83
0.03
11
PUSTÓŁ Władysław Zygmunt
12
4.41
0.07
12
JABŁOŃSKI Stanisław
9
3.30
0.05
13
KRAWCZYK Kazimierz Ignacy
6
2.20
0.04
14
WÓJCIK Zdzisław Maciej
7
2.57
0.04
15
WITKOWSKA Grażyna Stanisława
3
1.10
0.02
16
HAJDUK Tadeusz Jan
5
1.83
0.03
17
JELONEK Jan Adam
0
0.00
0.00
18
ŁEBEK Robert
2
0.73
0.01
19
KOWALCZYK Janusz
6
2.20
0.04
20
ROZMUS Stanisław
1
0.36
0.01
21
ZOLBACH Marcin
1
0.36
0.01
22
FLORCZYK-DWOJEWSKA Monika Magdalena
3
1.10
0.02
23
WOJTYŚ Ryszard
0
0.00
0.00
24
MARZEC Barbara Ewa
9
3.30
0.05
25
SYDOR Aleksandra Zofia
4
1.47
0.02
26
WÓJCIK Ewa Magdalena
30
11.02
0.18
27
WESOŁOWSKI Stanisław Szczepan
0
0.00
0.00
28
SUCHANEK Edyta
1
0.36
0.01
29
DUDA Anita
6
2.20
0.04
30
NIEDBALSKA Barbara
0
0.00
0.00
31
KOWALSKI Marcin Krzysztof
6
2.20
0.04
32
TOMASZEWSKA Edyta
7
2.57
0.04
Σ
272
100.00
1.63
.
.
Voting Results by location of ward electoral commission.
.
.
.
.
.
.
.
.
.
.
.
.
.
.
.
.
.
No.
Name
No. of entitled
to vote
No. of ballot
papers issued
No. of votes
No. of votes: per list / valid [%]
total
valid
per List
1
City
8882
4932
4929
4826
21
0.44
2
Country
28954
12308
12291
11860
251
2.12
.
Voting Results by number of inhabitants of commune
.
1
to 5 000
4637
1944
1944
1872
65
3.47
2
from 5 001 to 10 000
8311
3383
3383
3259
65
1.99
3
from 10 001 to 20 000
8417
3669
3667
3565
63
1.77
4
from 20 001 to 50 000
16471
8244
8226
7990
79
0.99
5
from 50 001 to 100 000
0
0
0
0
0
0.00
6
from 100 001 to 200 000
0
0
0
0
0
0.00
7
from 200 001 to 500 000
0
0
0
0
0
0.00
8
over 500 000
0
0
0
0
0
0.00
Legal Acts
Documents
Electoral Bodies
Election Committees and Candidates
Turnout
Results
Statistical Data
SENATE
Created by
Copyright © 2007
Mikrobit Sp. z o.o.
. All Rights Reserved.
top