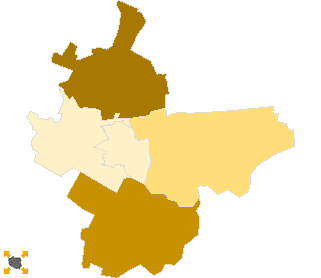
.
.
Legal Acts
Documents
Electoral Bodies
Election Committees and Candidates
Turnout
Results
Statistical Data
SENATE
Created by
.
.
Voting Results
.
.
.
Voting Results for Committee
.
.
.
.
.
.
.
.
.
.
.
.
.
.
.
.
.
.
.
.
Polska
/
Kielce
/
starachowicki, pow.
...
Komitet Wyborczy Samoobrona Rzeczpospolitej Polskiej
List's Number:
15
No. of valid votes:
35575
No. of votes per List:
705
1.98%
lack
1.52%
1.73%
1.94%
2.15%
2.36%
2.57%
2.78%
2.99%
3.20%
3.41%
not
of data
1.72%
1.93%
2.14%
2.35%
2.56%
2.77%
2.98%
3.19%
3.40%
3.62%
applicable
See also:
Turnout
Votes per Lists
Votes per Candidates
Information about Election Committee
Election results
Voting Results by location of ward electoral commission
.
.
Voting Results for Committee.
.
.
.
.
.
.
.
.
.
.
.
.
.
.
.
.
.
No.
Name
No. of entitled
to vote
No. of ballot papers
issued
No. of votes
No. of votes: per list / valid [%]
total
valid
per List
261102
Brody, gm.
8736
3572
3561
3455
75
2.17
261103
Mirzec, gm.
6728
3085
3084
2996
107
3.57
261104
Pawłów, gm.
11667
4282
4282
4125
139
3.37
261101
Starachowice, m.
44646
22751
22739
22293
341
1.53
261105
Wąchock, gm.
5858
2783
2782
2706
43
1.59
starachowicki, pow.
77635
36473
36448
35575
705
1.98
.
.
Voting Results for Candidates
.
.
.
.
.
.
.
.
.
.
.
.
.
.
.
No.
Surname Names
No. of votes
% No. of votes per candidate/No. per list
% No. of votes per candidate/No. of valid votes
1
OLEJNIK Małgorzata Dorota
91
12.90
0.26
2
GROSS Norbert Krzysztof
338
47.94
0.95
3
ADAMCZAK Józef
28
3.97
0.08
4
BĄK Józef Stanisław
35
4.96
0.10
5
DYRAGA Kazimierz
8
1.13
0.02
6
CHYC Kazimierz Józef
7
0.99
0.02
7
PŁUSA Szymon Wacław
18
2.55
0.05
8
BURAS Janusz
9
1.27
0.03
9
CICHOŃ Roman
11
1.56
0.03
10
SAGAN Józef
9
1.27
0.03
11
PUSTÓŁ Władysław Zygmunt
11
1.56
0.03
12
JABŁOŃSKI Stanisław
9
1.27
0.03
13
KRAWCZYK Kazimierz Ignacy
7
0.99
0.02
14
WÓJCIK Zdzisław Maciej
3
0.42
0.01
15
WITKOWSKA Grażyna Stanisława
10
1.41
0.03
16
HAJDUK Tadeusz Jan
3
0.42
0.01
17
JELONEK Jan Adam
6
0.85
0.02
18
ŁEBEK Robert
25
3.54
0.07
19
KOWALCZYK Janusz
5
0.70
0.01
20
ROZMUS Stanisław
7
0.99
0.02
21
ZOLBACH Marcin
3
0.42
0.01
22
FLORCZYK-DWOJEWSKA Monika Magdalena
4
0.56
0.01
23
WOJTYŚ Ryszard
4
0.56
0.01
24
MARZEC Barbara Ewa
5
0.70
0.01
25
SYDOR Aleksandra Zofia
0
0.00
0.00
26
WÓJCIK Ewa Magdalena
5
0.70
0.01
27
WESOŁOWSKI Stanisław Szczepan
5
0.70
0.01
28
SUCHANEK Edyta
4
0.56
0.01
29
DUDA Anita
14
1.98
0.04
30
NIEDBALSKA Barbara
1
0.14
0.00
31
KOWALSKI Marcin Krzysztof
10
1.41
0.03
32
TOMASZEWSKA Edyta
10
1.41
0.03
Σ
705
100.00
1.98
.
.
Voting Results by location of ward electoral commission.
.
.
.
.
.
.
.
.
.
.
.
.
.
.
.
.
.
No.
Name
No. of entitled
to vote
No. of ballot
papers issued
No. of votes
No. of votes: per list / valid [%]
total
valid
per List
1
City
47010
23953
23941
23464
357
1.52
2
Country
30625
12520
12507
12111
348
2.87
.
Voting Results by number of inhabitants of commune
.
1
to 5 000
0
0
0
0
0
0.00
2
from 5 001 to 10 000
12586
5868
5866
5702
150
2.63
3
from 10 001 to 20 000
20403
7854
7843
7580
214
2.82
4
from 20 001 to 50 000
0
0
0
0
0
0.00
5
from 50 001 to 100 000
44646
22751
22739
22293
341
1.53
6
from 100 001 to 200 000
0
0
0
0
0
0.00
7
from 200 001 to 500 000
0
0
0
0
0
0.00
8
over 500 000
0
0
0
0
0
0.00
Legal Acts
Documents
Electoral Bodies
Election Committees and Candidates
Turnout
Results
Statistical Data
SENATE
Created by
Copyright © 2007
Mikrobit Sp. z o.o.
. All Rights Reserved.
top