.
.
Legal Acts
Documents
Electoral Bodies
Election Committees and Candidates
Turnout
Results
Statistical Data
SENATE
Created by
.
.
Voting Results
.
.
.
Voting Results for Committee
.
.
.
.
.
.
.
.
.
.
.
.
.
.
.
.
.
.
.
.
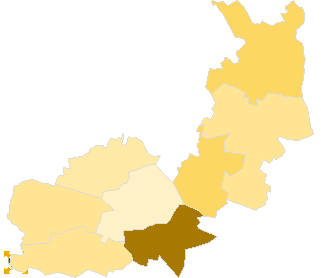
Polska
/
Kielce
/
opatowski, pow.
...
Komitet Wyborczy Samoobrona Rzeczpospolitej Polskiej
List's Number:
15
No. of valid votes:
17810
No. of votes per List:
492
2.76%
lack
1.52%
1.96%
2.40%
2.84%
3.28%
3.72%
4.16%
4.60%
5.04%
5.48%
not
of data
1.95%
2.39%
2.83%
3.27%
3.71%
4.15%
4.59%
5.03%
5.47%
5.92%
applicable
See also:
Turnout
Votes per Lists
Votes per Candidates
Information about Election Committee
Election results
Voting Results by location of ward electoral commission
.
.
Voting Results for Committee.
.
.
.
.
.
.
.
.
.
.
.
.
.
.
.
.
.
No.
Name
No. of entitled
to vote
No. of ballot papers
issued
No. of votes
No. of votes: per list / valid [%]
total
valid
per List
260601
Baćkowice, gm.
4172
1638
1638
1568
38
2.42
260602
Iwaniska, gm.
5594
2231
2230
2131
54
2.53
260603
Lipnik, gm.
4680
1771
1752
1681
99
5.89
260604
Opatów, gm.
10392
4672
4671
4468
68
1.52
260605
Ożarów, gm.
9295
3643
3638
3483
93
2.67
260606
Sadowie, gm.
3443
1277
1277
1237
28
2.26
260607
Tarłów, gm.
4649
1734
1734
1668
57
3.42
260608
Wojciechowice, gm.
3619
1644
1644
1574
55
3.49
opatowski, pow.
45844
18610
18584
17810
492
2.76
.
.
Voting Results for Candidates
.
.
.
.
.
.
.
.
.
.
.
.
.
.
.
No.
Surname Names
No. of votes
% No. of votes per candidate/No. per list
% No. of votes per candidate/No. of valid votes
1
OLEJNIK Małgorzata Dorota
127
25.81
0.71
2
GROSS Norbert Krzysztof
32
6.50
0.18
3
ADAMCZAK Józef
114
23.17
0.64
4
BĄK Józef Stanisław
22
4.47
0.12
5
DYRAGA Kazimierz
15
3.04
0.08
6
CHYC Kazimierz Józef
6
1.21
0.03
7
PŁUSA Szymon Wacław
7
1.42
0.04
8
BURAS Janusz
7
1.42
0.04
9
CICHOŃ Roman
18
3.65
0.10
10
SAGAN Józef
10
2.03
0.06
11
PUSTÓŁ Władysław Zygmunt
5
1.01
0.03
12
JABŁOŃSKI Stanisław
9
1.82
0.05
13
KRAWCZYK Kazimierz Ignacy
4
0.81
0.02
14
WÓJCIK Zdzisław Maciej
10
2.03
0.06
15
WITKOWSKA Grażyna Stanisława
5
1.01
0.03
16
HAJDUK Tadeusz Jan
6
1.21
0.03
17
JELONEK Jan Adam
34
6.91
0.19
18
ŁEBEK Robert
1
0.20
0.01
19
KOWALCZYK Janusz
5
1.01
0.03
20
ROZMUS Stanisław
5
1.01
0.03
21
ZOLBACH Marcin
2
0.40
0.01
22
FLORCZYK-DWOJEWSKA Monika Magdalena
4
0.81
0.02
23
WOJTYŚ Ryszard
2
0.40
0.01
24
MARZEC Barbara Ewa
10
2.03
0.06
25
SYDOR Aleksandra Zofia
2
0.40
0.01
26
WÓJCIK Ewa Magdalena
5
1.01
0.03
27
WESOŁOWSKI Stanisław Szczepan
1
0.20
0.01
28
SUCHANEK Edyta
0
0.00
0.00
29
DUDA Anita
9
1.82
0.05
30
NIEDBALSKA Barbara
3
0.60
0.02
31
KOWALSKI Marcin Krzysztof
2
0.40
0.01
32
TOMASZEWSKA Edyta
10
2.03
0.06
Σ
492
100.00
2.76
.
.
Voting Results by location of ward electoral commission.
.
.
.
.
.
.
.
.
.
.
.
.
.
.
.
.
.
No.
Name
No. of entitled
to vote
No. of ballot
papers issued
No. of votes
No. of votes: per list / valid [%]
total
valid
per List
1
City
11499
5057
5055
4856
86
1.77
2
Country
34345
13553
13529
12954
406
3.13
.
Voting Results by number of inhabitants of commune
.
1
to 5 000
7062
2921
2921
2811
83
2.95
2
from 5 001 to 10 000
19095
7374
7354
7048
248
3.52
3
from 10 001 to 20 000
19687
8315
8309
7951
161
2.02
4
from 20 001 to 50 000
0
0
0
0
0
0.00
5
from 50 001 to 100 000
0
0
0
0
0
0.00
6
from 100 001 to 200 000
0
0
0
0
0
0.00
7
from 200 001 to 500 000
0
0
0
0
0
0.00
8
over 500 000
0
0
0
0
0
0.00
Legal Acts
Documents
Electoral Bodies
Election Committees and Candidates
Turnout
Results
Statistical Data
SENATE
Created by
Copyright © 2007
Mikrobit Sp. z o.o.
. All Rights Reserved.
top