.
.
Legal Acts
Documents
Electoral Bodies
Election Committees and Candidates
Turnout
Results
Statistical Data
SENATE
Created by
.
.
Voting Results
.
.
.
Voting Results for Committee
.
.
.
.
.
.
.
.
.
.
.
.
.
.
.
.
.
.
.
.
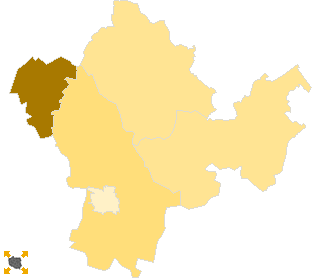
Polska
/
Gdynia
/
chojnicki, pow.
...
Komitet Wyborczy Samoobrona Rzeczpospolitej Polskiej
List's Number:
15
No. of valid votes:
36436
No. of votes per List:
861
2.36%
lack
1.18%
1.90%
2.62%
3.34%
4.06%
4.78%
5.50%
6.22%
6.94%
7.66%
not
of data
1.89%
2.61%
3.33%
4.05%
4.77%
5.49%
6.21%
6.93%
7.65%
8.38%
applicable
See also:
Turnout
Votes per Lists
Votes per Candidates
Information about Election Committee
Election results
Voting Results by location of ward electoral commission
.
.
Voting Results for Committee.
.
.
.
.
.
.
.
.
.
.
.
.
.
.
.
.
.
No.
Name
No. of entitled
to vote
No. of ballot papers
issued
No. of votes
No. of votes: per list / valid [%]
total
valid
per List
220202
Brusy, gm.
9935
5433
5432
5289
146
2.76
220203
Chojnice, gm.
12066
5648
5648
5441
213
3.91
220201
Chojnice, m.
31765
18128
18118
17741
211
1.19
220204
Czersk, gm.
15838
7398
7390
7189
226
3.14
220205
Konarzyny, gm.
1644
787
787
776
65
8.38
chojnicki, pow.
71248
37394
37375
36436
861
2.36
.
.
Voting Results for Candidates
.
.
.
.
.
.
.
.
.
.
.
.
.
.
.
No.
Surname Names
No. of votes
% No. of votes per candidate/No. per list
% No. of votes per candidate/No. of valid votes
1
WOSZCZEROWICZ Lech
156
18.11
0.43
2
MEYER Mieczysław Jan
71
8.24
0.19
3
WEJNER Edward
19
2.20
0.05
4
ŁUKA Grzegorz Tadeusz
51
5.92
0.14
5
BORZYSZKOWSKI Krzysztof Feliks
83
9.63
0.23
6
KLEIN Jerzy Mieczysław
17
1.97
0.05
7
LABUDA Maria Barbara
45
5.22
0.12
8
SAS-KOWALIK Ewa Krystyna
5
0.58
0.01
9
WOŹNIAK Wiktor
17
1.97
0.05
10
TALEWSKI Zbigniew Kazimierz
24
2.78
0.07
11
SZREDER Leopold
19
2.20
0.05
12
KOS Józef Antoni
12
1.39
0.03
13
ŻABIŃSKI Michał Justyn
10
1.16
0.03
14
PAWŁOWSKI Jerzy Jan
17
1.97
0.05
15
GOLONEK Zbigniew
12
1.39
0.03
16
LEPAK Stefan Jan
160
18.58
0.44
17
DYRMO Grzegorz Czesław
8
0.92
0.02
18
JAGIELSKA Bernadeta Halina
8
0.92
0.02
19
KAMIŃSKA Krystyna Elżbieta
11
1.27
0.03
20
WOLF-SOBIERALSKA Bożena Katarzyna
3
0.34
0.01
21
MALINOWSKA Dagmara Magdalena
16
1.85
0.04
22
KURECKI Tadeusz Maksymilian
3
0.34
0.01
23
SIKORSKI Zbigniew Stanisław
15
1.74
0.04
24
PIEPÓRKA Renata Izabela
6
0.69
0.02
25
MEKIN Małgorzata Magdalena
6
0.69
0.02
26
ZABOROWSKI Henryk Brunon
7
0.81
0.02
27
STUKAN Stanisław
4
0.46
0.01
28
HOJARSKA Magdalena Krystyna
56
6.50
0.15
Σ
861
100.00
2.36
.
.
Voting Results by location of ward electoral commission.
.
.
.
.
.
.
.
.
.
.
.
.
.
.
.
.
.
No.
Name
No. of entitled
to vote
No. of ballot
papers issued
No. of votes
No. of votes: per list / valid [%]
total
valid
per List
1
City
42703
23923
23912
23389
311
1.33
2
Country
28545
13471
13463
13047
550
4.22
.
Voting Results by number of inhabitants of commune
.
1
to 5 000
1644
787
787
776
65
8.38
2
from 5 001 to 10 000
0
0
0
0
0
0.00
3
from 10 001 to 20 000
22001
11081
11080
10730
359
3.35
4
from 20 001 to 50 000
47603
25526
25508
24930
437
1.75
5
from 50 001 to 100 000
0
0
0
0
0
0.00
6
from 100 001 to 200 000
0
0
0
0
0
0.00
7
from 200 001 to 500 000
0
0
0
0
0
0.00
8
over 500 000
0
0
0
0
0
0.00
Legal Acts
Documents
Electoral Bodies
Election Committees and Candidates
Turnout
Results
Statistical Data
SENATE
Created by
Copyright © 2007
Mikrobit Sp. z o.o.
. All Rights Reserved.
top