.
.
Legal Acts
Documents
Electoral Bodies
Election Committees and Candidates
Turnout
Results
Statistical Data
SENATE
Created by
.
.
Voting Results
.
.
.
Voting Results for Committee
.
.
.
.
.
.
.
.
.
.
.
.
.
.
.
.
.
.
.
.
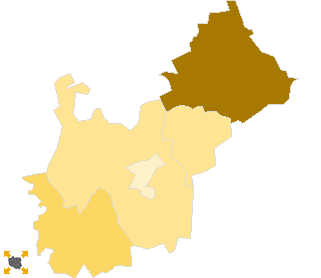
Polska
/
Białystok
/
zambrowski, pow.
...
Komitet Wyborczy Samoobrona Rzeczpospolitej Polskiej
List's Number:
15
No. of valid votes:
16727
No. of votes per List:
349
2.09%
lack
1.06%
1.49%
1.92%
2.35%
2.78%
3.21%
3.64%
4.07%
4.50%
4.93%
not
of data
1.48%
1.91%
2.34%
2.77%
3.20%
3.63%
4.06%
4.49%
4.92%
5.36%
applicable
See also:
Turnout
Votes per Lists
Votes per Candidates
Information about Election Committee
Election results
Voting Results by location of ward electoral commission
.
.
Voting Results for Committee.
.
.
.
.
.
.
.
.
.
.
.
.
.
.
.
.
.
No.
Name
No. of entitled
to vote
No. of ballot papers
issued
No. of votes
No. of votes: per list / valid [%]
total
valid
per List
201402
Kołaki Kościelne, gm.
1994
1135
1135
1117
25
2.24
201403
Rutki, gm.
5023
2303
2301
2193
116
5.29
201404
Szumowo, gm.
3976
1801
1801
1771
55
3.11
201405
Zambrów, gm.
7587
3418
3418
3323
64
1.93
201401
Zambrów, m.
18181
8466
8466
8323
89
1.07
zambrowski, pow.
36761
17123
17121
16727
349
2.09
.
.
Voting Results for Candidates
.
.
.
.
.
.
.
.
.
.
.
.
.
.
.
No.
Surname Names
No. of votes
% No. of votes per candidate/No. per list
% No. of votes per candidate/No. of valid votes
1
WIŚNIOWSKA Genowefa
73
20.91
0.44
2
WÓJCIK Janusz Marek
9
2.57
0.05
3
CHMIELEWSKI Andrzej Eugeniusz
10
2.86
0.06
4
GROMADZKI Sławomir
7
2.00
0.04
5
GAWRYLUK Mikołaj
8
2.29
0.05
6
FIERTEK Józef
84
24.06
0.50
7
ZDROJEWSKA Agnieszka
13
3.72
0.08
8
KORYTKOWSKI Kazimierz
8
2.29
0.05
9
KOWALSKI Wiktor
2
0.57
0.01
10
PUTRA Aleksander
14
4.01
0.08
11
DĄBROWSKI Piotr
9
2.57
0.05
12
KRASUSKA Beata
2
0.57
0.01
13
SŁAWIŃSKI Krzysztof
4
1.14
0.02
14
SADOWSKI Tadeusz
4
1.14
0.02
15
MIKUCKI Leszek
26
7.44
0.16
16
BORAWSKI Marek Jarosław
7
2.00
0.04
17
BOGUSŁAWSKI Mariusz
1
0.28
0.01
18
TISZUK Irena
2
0.57
0.01
19
KOWALEWSKI Adam
2
0.57
0.01
20
LISOWSKI Mariusz
3
0.85
0.02
21
NALEWAJKO Aleksander
3
0.85
0.02
22
CZERECH Magdalena
1
0.28
0.01
23
MAŁACHOWSKI Wacław
1
0.28
0.01
24
MILANOWSKI Leszek
1
0.28
0.01
25
GOSK Romuald Janusz
39
11.17
0.23
26
SKOWROŃSKI Wiesław
1
0.28
0.01
27
CHROSTOWSKI Krzysztof Czesław
2
0.57
0.01
28
MROCZKOWSKI Marek
2
0.57
0.01
29
SENDEK Sławomir Bogusław
2
0.57
0.01
30
ZABIELSKI Marek
9
2.57
0.05
Σ
349
100.00
2.08
.
.
Voting Results by location of ward electoral commission.
.
.
.
.
.
.
.
.
.
.
.
.
.
.
.
.
.
No.
Name
No. of entitled
to vote
No. of ballot
papers issued
No. of votes
No. of votes: per list / valid [%]
total
valid
per List
1
City
18181
8466
8466
8323
89
1.07
2
Country
18580
8657
8655
8404
260
3.09
.
Voting Results by number of inhabitants of commune
.
1
to 5 000
1994
1135
1135
1117
25
2.24
2
from 5 001 to 10 000
16586
7522
7520
7287
235
3.22
3
from 10 001 to 20 000
0
0
0
0
0
0.00
4
from 20 001 to 50 000
18181
8466
8466
8323
89
1.07
5
from 50 001 to 100 000
0
0
0
0
0
0.00
6
from 100 001 to 200 000
0
0
0
0
0
0.00
7
from 200 001 to 500 000
0
0
0
0
0
0.00
8
over 500 000
0
0
0
0
0
0.00
Legal Acts
Documents
Electoral Bodies
Election Committees and Candidates
Turnout
Results
Statistical Data
SENATE
Created by
Copyright © 2007
Mikrobit Sp. z o.o.
. All Rights Reserved.
top