.
.
Legal Acts
Documents
Electoral Bodies
Election Committees and Candidates
Turnout
Results
Statistical Data
SENATE
Created by
.
.
Voting Results
.
.
.
Voting Results for Committee
.
.
.
.
.
.
.
.
.
.
.
.
.
.
.
.
.
.
.
.
Polska
/
Białystok
/
augustowski, pow.
...
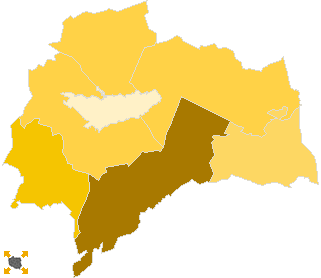
Komitet Wyborczy Samoobrona Rzeczpospolitej Polskiej
List's Number:
15
No. of valid votes:
20928
No. of votes per List:
684
3.27%
lack
1.75%
2.33%
2.91%
3.49%
4.07%
4.65%
5.23%
5.81%
6.39%
6.97%
not
of data
2.32%
2.90%
3.48%
4.06%
4.64%
5.22%
5.80%
6.38%
6.96%
7.55%
applicable
See also:
Turnout
Votes per Lists
Votes per Candidates
Information about Election Committee
Election results
Voting Results by location of ward electoral commission
.
.
Voting Results for Committee.
.
.
.
.
.
.
.
.
.
.
.
.
.
.
.
.
.
No.
Name
No. of entitled
to vote
No. of ballot papers
issued
No. of votes
No. of votes: per list / valid [%]
total
valid
per List
200102
Augustów, gm.
5239
2057
2057
2011
98
4.87
200101
Augustów, m.
23881
12388
12384
12216
215
1.76
200103
Bargłów Kościelny, gm.
4564
1586
1585
1563
83
5.31
200104
Lipsk, gm.
4645
1612
1612
1576
72
4.57
200105
Nowinka, gm.
2296
1060
1060
1028
49
4.77
200106
Płaska, gm.
2098
903
899
877
42
4.79
200107
Sztabin, gm.
4366
1689
1689
1657
125
7.54
augustowski, pow.
47089
21295
21286
20928
684
3.27
.
.
Voting Results for Candidates
.
.
.
.
.
.
.
.
.
.
.
.
.
.
.
No.
Surname Names
No. of votes
% No. of votes per candidate/No. per list
% No. of votes per candidate/No. of valid votes
1
WIŚNIOWSKA Genowefa
123
17.98
0.59
2
WÓJCIK Janusz Marek
22
3.21
0.11
3
CHMIELEWSKI Andrzej Eugeniusz
388
56.72
1.85
4
GROMADZKI Sławomir
3
0.43
0.01
5
GAWRYLUK Mikołaj
12
1.75
0.06
6
FIERTEK Józef
0
0.00
0.00
7
ZDROJEWSKA Agnieszka
11
1.60
0.05
8
KORYTKOWSKI Kazimierz
2
0.29
0.01
9
KOWALSKI Wiktor
2
0.29
0.01
10
PUTRA Aleksander
36
5.26
0.17
11
DĄBROWSKI Piotr
7
1.02
0.03
12
KRASUSKA Beata
0
0.00
0.00
13
SŁAWIŃSKI Krzysztof
7
1.02
0.03
14
SADOWSKI Tadeusz
8
1.16
0.04
15
MIKUCKI Leszek
10
1.46
0.05
16
BORAWSKI Marek Jarosław
12
1.75
0.06
17
BOGUSŁAWSKI Mariusz
1
0.14
0.00
18
TISZUK Irena
2
0.29
0.01
19
KOWALEWSKI Adam
0
0.00
0.00
20
LISOWSKI Mariusz
4
0.58
0.02
21
NALEWAJKO Aleksander
1
0.14
0.00
22
CZERECH Magdalena
2
0.29
0.01
23
MAŁACHOWSKI Wacław
2
0.29
0.01
24
MILANOWSKI Leszek
14
2.04
0.07
25
GOSK Romuald Janusz
2
0.29
0.01
26
SKOWROŃSKI Wiesław
3
0.43
0.01
27
CHROSTOWSKI Krzysztof Czesław
0
0.00
0.00
28
MROCZKOWSKI Marek
0
0.00
0.00
29
SENDEK Sławomir Bogusław
3
0.43
0.01
30
ZABIELSKI Marek
7
1.02
0.03
Σ
684
100.00
3.26
.
.
Voting Results by location of ward electoral commission.
.
.
.
.
.
.
.
.
.
.
.
.
.
.
.
.
.
No.
Name
No. of entitled
to vote
No. of ballot
papers issued
No. of votes
No. of votes: per list / valid [%]
total
valid
per List
1
City
25954
13238
13234
13051
240
1.84
2
Country
21135
8057
8052
7877
444
5.64
.
Voting Results by number of inhabitants of commune
.
1
to 5 000
4394
1963
1959
1905
91
4.78
2
from 5 001 to 10 000
18814
6944
6943
6807
378
5.55
3
from 10 001 to 20 000
0
0
0
0
0
0.00
4
from 20 001 to 50 000
23881
12388
12384
12216
215
1.76
5
from 50 001 to 100 000
0
0
0
0
0
0.00
6
from 100 001 to 200 000
0
0
0
0
0
0.00
7
from 200 001 to 500 000
0
0
0
0
0
0.00
8
over 500 000
0
0
0
0
0
0.00
Legal Acts
Documents
Electoral Bodies
Election Committees and Candidates
Turnout
Results
Statistical Data
SENATE
Created by
Copyright © 2007
Mikrobit Sp. z o.o.
. All Rights Reserved.
top