.
.
 
. .
Voting Results
.
. . Voting Results for Committee . .
. .
. . . . . . . . . . . . . . . .
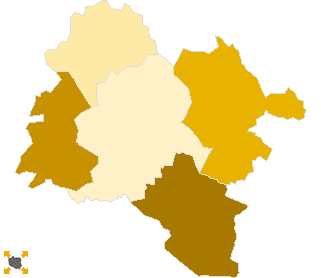
Polska / Wrocław / strzeliński, pow. ...
Komitet Wyborczy Samoobrona Rzeczpospolitej Polskiej
List's Number: 15
No. of valid votes: 16766
No. of votes per List: 344
2.05%
lack1.20%1.49%1.78%2.07%2.36%2.65%2.94%3.23%3.52%3.81%not
of data1.48%1.77%2.06%2.35%2.64%2.93%3.22%3.51%3.80%4.10%applicable

See also:
. . Voting Results for Committee. . .
. .
. . . . . . . . . . . . .
No. Name No. of entitled
to vote
No. of ballot papers
issued
No. of votes No. of votes: per list / valid [%]
total valid per List
021701Borów, gm.4180211921192066311.50
021702Kondratowice, gm.3764153215261492563.75
021703Przeworno, gm.4170168216821631664.05
021704Strzelin, gm.184219382936592161111.20
021705Wiązów, gm.5962242624252361803.39
  strzeliński, pow. 36497 17141 17117 16766 344 2.05

. . Voting Results for Candidates . .
. .
. . . . . . . . . . .
No. Surname Names No. of votes % No. of votes per candidate/No. per list % No. of votes per candidate/No. of valid votes
1ŻYSZKIEWICZ Jerzy9728.190.58
2BERUS Anna Eugenia205.810.12
3SZYLLE Dariusz Władysław82.320.05
4WARGOCKI Jan82.320.05
5WAJDA Marian Leord288.130.17
6ZAJĄC Wiesław Antoni277.840.16
7KOWALSKA Maria257.260.15
8KOZAK Iwona Stanisława133.770.08
9KOSIK Julian Sylwester144.060.08
10OLSZEWSKI Stanisław257.260.15
11KOZERA Kamil41.160.02
12LITWIN Janina Zbigniewa144.060.08
13GIEDRYS Elżbieta Barbara72.030.04
14DRÓŻDŻ Henryk41.160.02
15STEFANISZYN Arkadiusz Robert154.360.09
16JANKOWSKI Zygmunt Piotr51.450.03
17SOBURA Maria Małgorzata51.450.03
18ILKÓW Krzysztof Roman30.870.02
19NOGA Krystyna72.030.04
20ZARUCKA Wioletta Ewa00.00 0.00 
21KAMIŃSKI Maciej Sebastian61.740.04
22KODŹ Bożena Urszula00.00 0.00 
23JANUS Marcin10.290.01
24KOSTKA Rosanna00.00 0.00 
25HABER Kazimierz20.580.01
26TYL Czesław61.740.04
Σ   344 100.00 2.05
 
. . Voting Results by location of ward electoral commission. . .
. .
. . . . . . . . . . . . .
No. Name No. of entitled
to vote
No. of ballot
papers issued
No. of votes No. of votes: per list / valid [%]
total valid per List
1City13677726472597136811.14
2Country228209877985896302632.73
. Voting Results by number of inhabitants of commune .
1to 5 0003764153215261492563.75
2from 5 001 to 10 000143126227622660581772.92
3from 10 001 to 20 000000000.00 
4from 20 001 to 50 000184219382936592161111.20
5from 50 001 to 100 000000000.00 
6from 100 001 to 200 000000000.00 
7from 200 001 to 500 000000000.00 
8over 500 000000000.00 

  Legal Acts Documents Electoral Bodies Election Committees and Candidates Turnout Results Statistical Data SENATE Created by
 top