|
See also:
|
| . |
. |
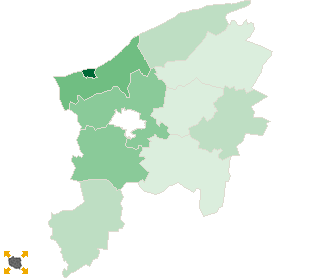
Number of people entitled to vote, number of ballot papers issued |
. |
. |
| . |
. |
| . |
. |
. |
. |
. |
. |
. |
. |
. |
. |
. |
. |
| No. |
Name |
No. of polling |
No. of people
entitled to vote |
No. of
ballot papers
issued |
No. of ballot papers issued / No. of people entitled to vote [%] |
| wards |
wards which
transmitted the results |
| 221202 | Damnica, gm. | 3 | 3 | 4663 | 1339 | 28.72 |  |
| 221203 | Dębnica Kaszubska, gm. | 6 | 6 | 7251 | 1997 | 27.54 | |
| 221204 | Główczyce, gm. | 12 | 12 | 7256 | 1986 | 27.37 | |
| 221205 | Kępice, gm. | 7 | 7 | 7338 | 2207 | 30.08 | |
| 221206 | Kobylnica, gm. | 6 | 6 | 7725 | 2435 | 31.52 | |
| 221207 | Potęgowo, gm. | 5 | 5 | 5355 | 1547 | 28.89 | |
| 221208 | Słupsk, gm. | 8 | 8 | 10704 | 3376 | 31.54 | |
| 221209 | Smołdzino, gm. | 2 | 2 | 2721 | 798 | 29.33 | |
| 221210 | Ustka, gm. | 14 | 14 | 6025 | 2006 | 33.29 | |
| 221201 | Ustka, m. | 10 | 10 | 14249 | 5824 | 40.87 | |
| |
słupski, pow. |
73 |
73 |
73287 |
23515 |
32.09 |
 |
|
| |
| . |
. |
Turnout by location of ward electoral commission |
. |
. |
| . |
. |
| . |
. |
. |
. |
. |
. |
. |
. |
. |
. |
. |
. |
| No. |
Name |
No. of polling |
No. of people
entitled to vote |
No. of
ballot papers
issued |
No. of ballot papers issued / No. of people entitled to vote [%] |
| wards |
wards which
transmitted the results |
| 1 | rural commune | 56 | 56 | 51700 | 15484 | 29.95 | |
| 2 | urban - rural commune | 7 | 7 | 7338 | 2207 | 30.08 | |
| 3 | urban commune | 10 | 10 | 14249 | 5824 | 40.87 | |
|
|


 Legal Acts

 Legal Acts