|
See also:
|
| . |
. |
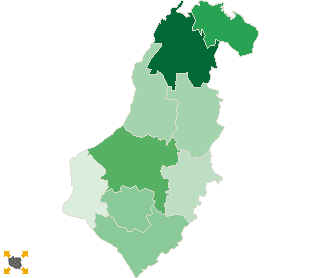
Voting results |
. |
. |
| . |
. |
| . |
. |
. |
. |
. |
. |
. |
. |
. |
. |
. |
. |
| No. |
Name |
No. entitled
to vote |
No. of ballot
papers issued |
No. of |
No. of ballot papers issued / No. entitled to vote
[%] |
| total votes |
valid votes |
| 320601 | Banie, gm. | 5109 | 1978 | 1978 | 1872 | 38.72 |  |
| 320602 | Cedynia, gm. | 3481 | 1199 | 1197 | 1135 | 34.44 | |
| 320603 | Chojna, gm. | 10905 | 4832 | 4828 | 4693 | 44.31 | |
| 320604 | Gryfino, gm. | 25053 | 13413 | 13397 | 13088 | 53.54 | |
| 320605 | Mieszkowice, gm. | 5780 | 2422 | 2422 | 2354 | 41.90 | |
| 320606 | Moryń, gm. | 3475 | 1450 | 1450 | 1377 | 41.73 | |
| 320607 | Stare Czarnowo, gm. | 3011 | 1426 | 1426 | 1384 | 47.36 | |
| 320608 | Trzcińsko-Zdrój, gm. | 4574 | 1738 | 1738 | 1699 | 38.00 | |
| 320609 | Widuchowa, gm. | 4286 | 1707 | 1707 | 1610 | 39.83 | |
| |
gryfiński, pow. |
65674 |
30165 |
30143 |
29212 |
45.93 |
 |
|
| |
| . |
. |
Turnout by location of ward electoral commission |
. |
. |
| . |
. |
| . |
. |
. |
. |
. |
. |
. |
. |
. |
. |
. |
. |
| No. |
Name |
No. entitled
to vote |
No. of ballot
papers issued |
No. of |
No. of ballot papers issued / No. entitled to vote
[%] |
| total votes |
valid votes |
| 1 | City | 35042 | 18258 | 18248 | 17810 | 52.10 | |
| 2 | Country | 30632 | 11907 | 11895 | 11402 | 38.87 | |
| . |
Turnout by number of inhabitants of commune |
. |
| 1 | to 5 000 | 9967 | 4075 | 4073 | 3896 | 40.88 | |
| 2 | from 5 001 to 10 000 | 19749 | 7845 | 7845 | 7535 | 39.72 | |
| 3 | from 10 001 to 20 000 | 10905 | 4832 | 4828 | 4693 | 44.31 | |
| 4 | from 20 001 to 50 000 | 25053 | 13413 | 13397 | 13088 | 53.54 | |
| 5 | from 50 001 to 100 000 | 0 | 0 | 0 | 0 | 0.00 | |
| 6 | from 100 001 to 200 000 | 0 | 0 | 0 | 0 | 0.00 | |
| 7 | from 200 001 to 500 000 | 0 | 0 | 0 | 0 | 0.00 | |
| 8 | over 500 000 | 0 | 0 | 0 | 0 | 0.00 | |
|
|


 Legal Acts

 Legal Acts