|
See also:
|
| . |
. |
Voting results |
. |
. |
| . |
. |
| . |
. |
. |
. |
. |
. |
. |
. |
. |
. |
. |
. |
| No. |
Name |
No. entitled
to vote |
No. of ballot
papers issued |
No. of |
No. of ballot papers issued / No. entitled to vote
[%] |
| total votes |
valid votes |
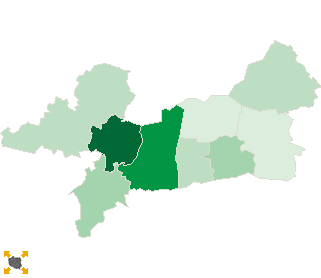
| 301902 | Białośliwie, gm. | 3689 | 1857 | 1833 | 1762 | 50.34 |  |
| 301903 | Kaczory, gm. | 5711 | 3263 | 3261 | 3111 | 57.14 |  |
| 301904 | Łobżenica, gm. | 7483 | 3638 | 3637 | 3457 | 48.62 |  |
| 301905 | Miasteczko Krajeńskie, gm. | 2465 | 1203 | 1203 | 1152 | 48.80 |  |
| 301901 | Piła, m. | 59327 | 36400 | 36381 | 35759 | 61.35 |  |
| 301906 | Szydłowo, gm. | 5935 | 2829 | 2829 | 2704 | 47.67 |  |
| 301907 | Ujście, gm. | 6205 | 3101 | 3100 | 2976 | 49.98 |  |
| 301908 | Wyrzysk, gm. | 10894 | 5007 | 5004 | 4834 | 45.96 |  |
| 301909 | Wysoka, gm. | 5124 | 2352 | 2352 | 2225 | 45.90 |  |
| |
pilski, pow. |
106833 |
59650 |
59600 |
57980 |
55.83 |
 |
|
| |
| . |
. |
Turnout by location of ward electoral commission |
. |
. |
| . |
. |
| . |
. |
. |
. |
. |
. |
. |
. |
. |
. |
. |
. |
| No. |
Name |
No. entitled
to vote |
No. of ballot
papers issued |
No. of |
No. of ballot papers issued / No. entitled to vote
[%] |
| total votes |
valid votes |
| 1 | City | 72353 | 43208 | 43186 | 42302 | 59.72 |  |
| 2 | Country | 34480 | 16442 | 16414 | 15678 | 47.69 |  |
| . |
Turnout by number of inhabitants of commune |
. |
| 1 | to 5 000 | 6154 | 3060 | 3036 | 2914 | 49.72 |  |
| 2 | from 5 001 to 10 000 | 22975 | 11545 | 11542 | 11016 | 50.25 |  |
| 3 | from 10 001 to 20 000 | 18377 | 8645 | 8641 | 8291 | 47.04 |  |
| 4 | from 20 001 to 50 000 | 0 | 0 | 0 | 0 | 0.00 | |
| 5 | from 50 001 to 100 000 | 59327 | 36400 | 36381 | 35759 | 61.35 |  |
| 6 | from 100 001 to 200 000 | 0 | 0 | 0 | 0 | 0.00 | |
| 7 | from 200 001 to 500 000 | 0 | 0 | 0 | 0 | 0.00 | |
| 8 | over 500 000 | 0 | 0 | 0 | 0 | 0.00 | |
|
|


 Legal Acts
 Documents
 Electoral Bodies
 Election Committees and Candidates
 Turnout
 Results
 Statistical Data
 SENATE
 Created by


 Legal Acts
 Documents
 Electoral Bodies
 Election Committees and Candidates
 Turnout
 Results
 Statistical Data
 SENATE
 Created by


