|
See also:
|
| . |
. |
Voting results |
. |
. |
| . |
. |
| . |
. |
. |
. |
. |
. |
. |
. |
. |
. |
. |
. |
| No. |
Name |
No. entitled
to vote |
No. of ballot
papers issued |
No. of |
No. of ballot papers issued / No. entitled to vote
[%] |
| total votes |
valid votes |
| 160701 | Głuchołazy, gm. | 21256 | 9573 | 9571 | 9332 | 45.04 |  |
| 160702 | Kamiennik, gm. | 2952 | 1236 | 1236 | 1211 | 41.87 | |
| 160703 | Korfantów, gm. | 7804 | 2647 | 2647 | 2526 | 33.92 | |
| 160704 | Łambinowice, gm. | 6168 | 2528 | 2528 | 2445 | 40.99 | |
| 160705 | Nysa, gm. | 49236 | 25115 | 25103 | 24655 | 51.01 | |
| 160706 | Otmuchów, gm. | 11611 | 5298 | 5272 | 5073 | 45.63 | |
| 160707 | Paczków, gm. | 10944 | 5009 | 5000 | 4828 | 45.77 | |
| 160708 | Pakosławice, gm. | 3031 | 1249 | 1248 | 1213 | 41.21 | |
| 160709 | Skoroszyce, gm. | 5068 | 1989 | 1989 | 1912 | 39.25 | |
| |
nyski, pow. |
118070 |
54644 |
54594 |
53195 |
46.28 |
 |
|
| |
| . |
. |
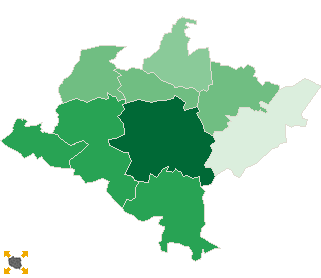
Turnout by location of ward electoral commission |
. |
. |
| . |
. |
| . |
. |
. |
. |
. |
. |
. |
. |
. |
. |
. |
. |
| No. |
Name |
No. entitled
to vote |
No. of ballot
papers issued |
No. of |
No. of ballot papers issued / No. entitled to vote
[%] |
| total votes |
valid votes |
| 1 | City | 65972 | 33572 | 33534 | 32863 | 50.89 | |
| 2 | Country | 52098 | 21072 | 21060 | 20332 | 40.45 | |
| . |
Turnout by number of inhabitants of commune |
. |
| 1 | to 5 000 | 5983 | 2485 | 2484 | 2424 | 41.53 | |
| 2 | from 5 001 to 10 000 | 19040 | 7164 | 7164 | 6883 | 37.63 | |
| 3 | from 10 001 to 20 000 | 22555 | 10307 | 10272 | 9901 | 45.70 | |
| 4 | from 20 001 to 50 000 | 21256 | 9573 | 9571 | 9332 | 45.04 | |
| 5 | from 50 001 to 100 000 | 49236 | 25115 | 25103 | 24655 | 51.01 | |
| 6 | from 100 001 to 200 000 | 0 | 0 | 0 | 0 | 0.00 | |
| 7 | from 200 001 to 500 000 | 0 | 0 | 0 | 0 | 0.00 | |
| 8 | over 500 000 | 0 | 0 | 0 | 0 | 0.00 | |
|
|


 Legal Acts

 Legal Acts