|
See also:
|
| . |
. |
Voting Results for Committee. |
. |
. |
| . |
. |
| . |
. |
. |
. |
. |
. |
. |
. |
. |
. |
. |
. |
. |
| No. |
Name |
No. of entitled
to vote |
No. of ballot papers
issued |
No. of votes |
No. of votes: per list / valid [%] |
| total |
valid |
per List |
| 221504 | Choczewo, gm. | 4474 | 1936 | 1934 | 1851 | 184 | 9.94 |  |
| 221505 | Gniewino, gm. | 4930 | 2265 | 2264 | 2181 | 161 | 7.38 | |
| 221506 | Linia, gm. | 4116 | 2110 | 2105 | 2019 | 99 | 4.90 | |
| 221507 | Luzino, gm. | 9061 | 4842 | 4839 | 4708 | 261 | 5.54 | |
| 221508 | Łęczyce, gm. | 8253 | 3951 | 3951 | 3832 | 263 | 6.86 | |
| 221501 | Reda, m. | 14349 | 9001 | 8998 | 8854 | 913 | 10.31 | |
| 221502 | Rumia, m. | 34902 | 22616 | 22601 | 22298 | 2187 | 9.81 | |
| 221509 | Szemud, gm. | 9355 | 5179 | 5179 | 5052 | 410 | 8.12 | |
| 221510 | Wejherowo, gm. | 13474 | 7130 | 7130 | 6941 | 496 | 7.15 | |
| 221503 | Wejherowo, m. | 36709 | 22070 | 22058 | 21682 | 2183 | 10.07 | |
| |
wejherowski, pow. |
139623 |
81100 |
81059 |
79418 |
7157 |
9.01 |
 |
|
| |
| . |
. |
Voting Results by location of ward electoral commission. |
. |
. |
| . |
. |
| . |
. |
. |
. |
. |
. |
. |
. |
. |
. |
. |
. |
. |
| No. |
Name |
No. of entitled
to vote |
No. of ballot
papers issued |
No. of votes |
No. of votes: per list / valid [%] |
| total |
valid |
per List |
| 1 | City | 85960 | 53687 | 53657 | 52834 | 5283 | 10.00 | |
| 2 | Country | 53663 | 27413 | 27402 | 26584 | 1874 | 7.05 | |
| . |
Voting Results by number of inhabitants of commune |
. |
| 1 | to 5 000 | 0 | 0 | 0 | 0 | 0 | 0.00 | |
| 2 | from 5 001 to 10 000 | 13520 | 6311 | 6303 | 6051 | 444 | 7.34 | |
| 3 | from 10 001 to 20 000 | 54492 | 30103 | 30097 | 29387 | 2343 | 7.97 | |
| 4 | from 20 001 to 50 000 | 71611 | 44686 | 44659 | 43980 | 4370 | 9.94 | |
| 5 | from 50 001 to 100 000 | 0 | 0 | 0 | 0 | 0 | 0.00 | |
| 6 | from 100 001 to 200 000 | 0 | 0 | 0 | 0 | 0 | 0.00 | |
| 7 | from 200 001 to 500 000 | 0 | 0 | 0 | 0 | 0 | 0.00 | |
| 8 | over 500 000 | 0 | 0 | 0 | 0 | 0 | 0.00 | |
|
|


 Legal Acts
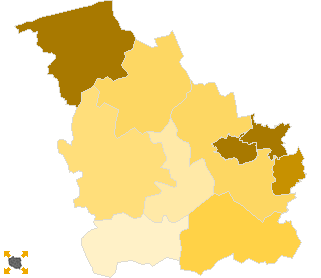
 Legal Acts