|
See also:
|
| . |
. |
Voting Results for Committee. |
. |
. |
| . |
. |
| . |
. |
. |
. |
. |
. |
. |
. |
. |
. |
. |
. |
. |
| No. |
Name |
No. of entitled
to vote |
No. of ballot papers
issued |
No. of votes |
No. of votes: per list / valid [%] |
| total |
valid |
per List |
| 140601 | Belsk Duży, gm. | 5275 | 2815 | 2815 | 2752 | 146 | 5.31 |  |
| 140602 | Błędów, gm. | 6416 | 3267 | 3266 | 3200 | 134 | 4.19 | |
| 140603 | Chynów, gm. | 7352 | 3550 | 3550 | 3472 | 281 | 8.09 | |
| 140604 | Goszczyn, gm. | 2288 | 1256 | 1256 | 1222 | 21 | 1.72 | |
| 140605 | Grójec, gm. | 19177 | 10236 | 10235 | 10001 | 1042 | 10.42 | |
| 140606 | Jasieniec, gm. | 4242 | 2024 | 2024 | 1971 | 115 | 5.83 | |
| 140607 | Mogielnica, gm. | 7490 | 3633 | 3623 | 3548 | 228 | 6.43 | |
| 140608 | Nowe Miasto nad Pilicą, gm. | 7207 | 3815 | 3814 | 3716 | 267 | 7.19 | |
| 140609 | Pniewy, gm. | 3646 | 1715 | 1715 | 1672 | 126 | 7.54 | |
| 140611 | Warka, gm. | 14892 | 7856 | 7851 | 7717 | 480 | 6.22 | |
| |
grójecki, pow. |
77985 |
40167 |
40149 |
39271 |
2840 |
7.23 |
 |
|
| |
| . |
. |
Voting Results by location of ward electoral commission. |
. |
. |
| . |
. |
| . |
. |
. |
. |
. |
. |
. |
. |
. |
. |
. |
. |
. |
| No. |
Name |
No. of entitled
to vote |
No. of ballot
papers issued |
No. of votes |
No. of votes: per list / valid [%] |
| total |
valid |
per List |
| 1 | City | 27606 | 15359 | 15357 | 15008 | 1630 | 10.86 | |
| 2 | Country | 50379 | 24808 | 24792 | 24263 | 1210 | 4.99 | |
| . |
Voting Results by number of inhabitants of commune |
. |
| 1 | to 5 000 | 5934 | 2971 | 2971 | 2894 | 147 | 5.08 | |
| 2 | from 5 001 to 10 000 | 37982 | 19104 | 19092 | 18659 | 1171 | 6.28 | |
| 3 | from 10 001 to 20 000 | 14892 | 7856 | 7851 | 7717 | 480 | 6.22 | |
| 4 | from 20 001 to 50 000 | 19177 | 10236 | 10235 | 10001 | 1042 | 10.42 | |
| 5 | from 50 001 to 100 000 | 0 | 0 | 0 | 0 | 0 | 0.00 | |
| 6 | from 100 001 to 200 000 | 0 | 0 | 0 | 0 | 0 | 0.00 | |
| 7 | from 200 001 to 500 000 | 0 | 0 | 0 | 0 | 0 | 0.00 | |
| 8 | over 500 000 | 0 | 0 | 0 | 0 | 0 | 0.00 | |
|
|


 Legal Acts
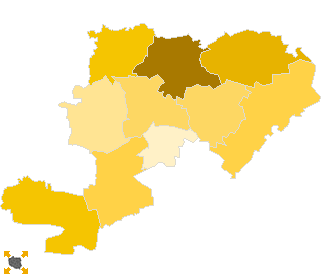
 Legal Acts