.
.
 
. .
Voting Results
.
. . Voting Results for Committee . .
. .
. . . . . . . . . . . . . . . .
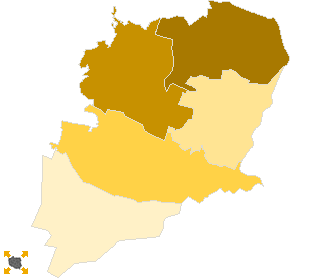
Polska / Katowice / bieruńsko-lędziński, pow. ...
Komitet Wyborczy Polskiego Stronnictwa Ludowego
List's Number: 10
No. of valid votes: 24031
No. of votes per List: 760
3.16%
lack2.65%2.74%2.83%2.92%3.01%3.10%3.19%3.28%3.37%3.46%not
of data2.73%2.82%2.91%3.00%3.09%3.18%3.27%3.36%3.45%3.55%applicable

See also:
. . Voting Results for Committee. . .
. .
. . . . . . . . . . . . .
No. Name No. of entitled
to vote
No. of ballot papers
issued
No. of votes No. of votes: per list / valid [%]
total valid per List
241401Bieruń, m.156158615860983562613.12
241404Bojszowy, gm.5195323032303162842.66
241405Chełm Śląski, gm.4555252025202466722.92
241402Imielin, m.62883684368236111253.46
241403Lędziny, m.125826587658564362183.39
  bieruńsko-lędziński, pow. 44235 24636 24626 24031 760 3.16

. . Voting Results for Candidates . .
. .
. . . . . . . . . . .
No. Surname Names No. of votes % No. of votes per candidate/No. per list % No. of votes per candidate/No. of valid votes
1PIOTROWSKI Leszek21127.760.88
2MAGDZIORZ Gabriela Maria638.280.26
3ZAWADZKI Józef Antoni273.550.11
4KONIECZNA Barbara Józefa14318.810.60
5BRZEZIŃSKA Maria Joanna405.260.17
6MAKULA Marian Paweł303.940.12
7MIODUSZEWSKI Piotr182.360.07
8PIASECKA Krystyna303.940.12
9NYCZ Robert Florian425.520.17
10MARCELA Józef Michał222.890.09
11LACH Andrzej Michał91.180.04
12MATUSZCZYK Andrzej Czesław121.570.05
13JAKUBCZYK Magda Maria182.360.07
14SKRZYPEK Damian Grzegorz101.310.04
15KOT Grzegorz Benedykt233.020.10
16KARASEWICZ Jacek Artur30.390.01
17PATEREK - VON SPERLING Andrzej60.780.02
18TARGOSZ Sylwester Krystian101.310.04
19LATOS Robert Sebastian20.260.01
20WIESIOŁEK Tomasz10.130.00 
21KORPOK Beata101.310.04
22ANDRZEJCZAK Marian Józef30.390.01
23ŚMIEJA Patrycja Stefania141.840.06
24SKWIRA Zygmunt Jerzy131.710.05
Σ   760 100.00 3.16
 
. . Voting Results by location of ward electoral commission. . .
. .
. . . . . . . . . . . . .
No. Name No. of entitled
to vote
No. of ballot
papers issued
No. of votes No. of votes: per list / valid [%]
total valid per List
1City344851888618876184036043.28
2Country97505750575056281562.77
. Voting Results by number of inhabitants of commune .
1to 5 000000000.00 
2from 5 001 to 10 000160389434943292392813.04
3from 10 001 to 20 000281971520215194147924793.24
4from 20 001 to 50 000000000.00 
5from 50 001 to 100 000000000.00 
6from 100 001 to 200 000000000.00 
7from 200 001 to 500 000000000.00 
8over 500 000000000.00 

  Legal Acts Documents Electoral Bodies Election Committees and Candidates Turnout Results Statistical Data SENATE Created by
 top