.
.
 
. .
Voting Results
.
. . Voting Results for Committee . .
. .
. . . . . . . . . . . . . . . .
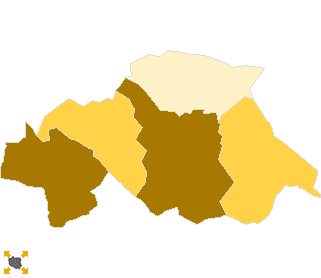
Polska / Rzeszów / strzyżowski, pow. ...
Komitet Wyborczy Polskiego Stronnictwa Ludowego
List's Number: 10
No. of valid votes: 22003
No. of votes per List: 4253
19.33%
lack11.44%12.68%13.92%15.16%16.40%17.64%18.88%20.12%21.36%22.60%not
of data12.67%13.91%15.15%16.39%17.63%18.87%20.11%21.35%22.59%23.84%applicable

See also:
. . Voting Results for Committee. . .
. .
. . . . . . . . . . . . .
No. Name No. of entitled
to vote
No. of ballot papers
issued
No. of votes No. of votes: per list / valid [%]
total valid per List
181901Czudec, gm.899247014699459552611.45
181902Frysztak, gm.806835453543343481823.82
181903Niebylec, gm.818039363936384071018.49
181904Strzyżów, gm.16501753575347313167222.86
181905Wiśniowa, gm.652528792865282152718.68
  strzyżowski, pow. 48266 22596 22577 22003 4253 19.33

. . Voting Results for Candidates . .
. .
. . . . . . . . . . .
No. Surname Names No. of votes % No. of votes per candidate/No. per list % No. of votes per candidate/No. of valid votes
1BURY Jan178742.018.12
2DEPTUŁA Leszek Roman952.230.43
3RYGIEL Wiesław Andrzej180.420.08
4PIENIĄDZ Jan Stanisław190.440.09
5KAWA Mariusz169339.807.69
6WRZASK Stefan541.260.25
7WALIŁKO Gabriel Stanisław60.140.03
8PYCHOWSKI Artur Juliusz20.040.01
9KASZYCA Tadeusz80.180.04
10HALESIAK Tadeusz130.300.06
11SERAFIN Danuta210.490.10
12WYWROCKI Waldemar Ludwik200.470.09
13MICAŁ Zbigniew20.040.01
14SZCZĘCH Władysław120.280.05
15DYBSKA Barbara170.390.08
16MUSIAŁ Feliks Jan3839.001.74
17ROLNICKI Piotr Kazimierz60.140.03
18LIGAS Tadeusz30.070.01
19WOŁOWIEC Zdzisław40.090.02
20KOCZUR Dorota Krystyna70.160.03
21SZPILA Janusz20.040.01
22STĘPIEŃ Lesław Jan140.320.06
23FĄFARA Jerzy Janusz170.390.08
24ZACIOS Aleksander100.230.05
25TWARDUŚ Zofia80.180.04
26BIAŁAS Stanisława30.070.01
27PERET Bogusław Stanisław00.00 0.00 
28SZEWCZYK Mariusz Krzysztof40.090.02
29KŁECZEK Marian Kazimierz130.300.06
30RĘKAS Zbigniew Władysław120.280.05
Σ   4253 100.00 19.32
 
. . Voting Results by location of ward electoral commission. . .
. .
. . . . . . . . . . . . .
No. Name No. of entitled
to vote
No. of ballot
papers issued
No. of votes No. of votes: per list / valid [%]
total valid per List
1City706335363536345167319.50
2Country41203190601904118552358019.30
. Voting Results by number of inhabitants of commune .
1to 5 000000000.00 
2from 5 001 to 10 000652528792865282152718.68
3from 10 001 to 20 00025240121821217811869205417.31
4from 20 001 to 50 00016501753575347313167222.86
5from 50 001 to 100 000000000.00 
6from 100 001 to 200 000000000.00 
7from 200 001 to 500 000000000.00 
8over 500 000000000.00 

  Legal Acts Documents Electoral Bodies Election Committees and Candidates Turnout Results Statistical Data SENATE Created by
 top