.
.
 
. .
Voting Results
.
. . Voting Results for Committee . .
. .
. . . . . . . . . . . . . . . .
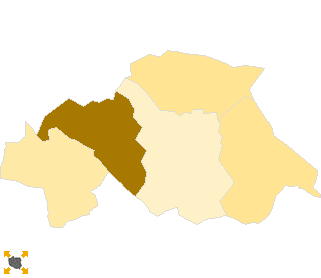
Polska / Rzeszów / strzyżowski, pow. ...
Komitet Wyborczy Liga Polskich Rodzin
List's Number: 3
No. of valid votes: 22003
No. of votes per List: 483
2.20%
lack1.58%1.83%2.08%2.33%2.58%2.83%3.08%3.33%3.58%3.83%not
of data1.82%2.07%2.32%2.57%2.82%3.07%3.32%3.57%3.82%4.08%applicable

See also:
. . Voting Results for Committee. . .
. .
. . . . . . . . . . . . .
No. Name No. of entitled
to vote
No. of ballot papers
issued
No. of votes No. of votes: per list / valid [%]
total valid per List
181901Czudec, gm.8992470146994595982.13
181902Frysztak, gm.8068354535433434712.07
181903Niebylec, gm.8180393639363840852.21
181904Strzyżów, gm.165017535753473131161.59
181905Wiśniowa, gm.65252879286528211134.01
  strzyżowski, pow. 48266 22596 22577 22003 483 2.20

. . Voting Results for Candidates . .
. .
. . . . . . . . . . .
No. Surname Names No. of votes % No. of votes per candidate/No. per list % No. of votes per candidate/No. of valid votes
1KŁECZEK Dariusz Antoni5511.380.25
2MURIAS Halina Maria11022.770.50
3MAZUR Krzysztof265.380.12
4ROMANIUK Bogdan Piotr81.650.04
5SZYPUŁA Andrzej336.830.15
6ZIĘBA Tadeusz Mikołaj265.380.12
7TOFILSKI Bogusław71.440.03
8CIEPLIŃSKI Piotr173.510.08
9SKOWRON Andrzej Jan30.620.01
10WĄSIK Stanisław102.070.05
11WRÓBEL Halina Grażyna193.930.09
12CZUBAT Krzysztof40.820.02
13SZAFRAŃSKI Paweł255.170.11
14KOZEK Marian40.820.02
15BARSZCZ Renata71.440.03
16SZOSTEK Alfred316.410.14
17CHMURA Józef Czesław10.200.00 
18KOLASIŃSKI Krzysztof20.410.01
19SZWANDROK Dariusz Adam30.620.01
20GIEROŃ Mirosław Zygmunt30.620.01
21DZIUSZYŃSKI Lech Grzegorz20.410.01
22KIDA Grzegorz Aleksander10.200.00 
23SIKORA Emil6112.620.28
24OSTROWSKA Ewelina Monika61.240.03
25MAŃKO Zbigniew102.070.05
26SERAFIN Piotr Jacek20.410.01
27KURZYNA Ramona10.200.00 
28KRZANOWSKI Bogusław61.240.03
Σ   483 100.00 2.19
 
. . Voting Results by location of ward electoral commission. . .
. .
. . . . . . . . . . . . .
No. Name No. of entitled
to vote
No. of ballot
papers issued
No. of votes No. of votes: per list / valid [%]
total valid per List
1City7063353635363451561.62
2Country412031906019041185524272.30
. Voting Results by number of inhabitants of commune .
1to 5 000000000.00 
2from 5 001 to 10 00065252879286528211134.01
3from 10 001 to 20 000252401218212178118692542.14
4from 20 001 to 50 000165017535753473131161.59
5from 50 001 to 100 000000000.00 
6from 100 001 to 200 000000000.00 
7from 200 001 to 500 000000000.00 
8over 500 000000000.00 

  Legal Acts Documents Electoral Bodies Election Committees and Candidates Turnout Results Statistical Data SENATE Created by
 top