|
See also:
|
| . |
. |
Voting Results for Committee. |
. |
. |
| . |
. |
| . |
. |
. |
. |
. |
. |
. |
. |
. |
. |
. |
. |
. |
| No. |
Name |
No. of entitled
to vote |
No. of ballot papers
issued |
No. of votes |
No. of votes: per list / valid [%] |
| total |
valid |
per List |
| 040702 | Dąbrowa Biskupia, gm. | 4067 | 1342 | 1341 | 1296 | 17 | 1.31 |  |
| 040703 | Gniewkowo, gm. | 11524 | 4834 | 4799 | 4657 | 67 | 1.44 | |
| 040704 | Inowrocław, gm. | 8709 | 3644 | 3641 | 3527 | 40 | 1.13 | |
| 040701 | Inowrocław, m. | 63185 | 35037 | 34975 | 34217 | 279 | 0.82 | |
| 040705 | Janikowo, gm. | 10749 | 5016 | 5015 | 4845 | 61 | 1.26 | |
| 040706 | Kruszwica, gm. | 15954 | 6863 | 6861 | 6610 | 80 | 1.21 | |
| 040707 | Pakość, gm. | 7932 | 3595 | 3595 | 3496 | 49 | 1.40 | |
| 040708 | Rojewo, gm. | 3560 | 1381 | 1380 | 1343 | 25 | 1.86 | |
| 040709 | Złotniki Kujawskie, gm. | 7003 | 2909 | 2900 | 2795 | 65 | 2.33 | |
| |
inowrocławski, pow. |
132683 |
64621 |
64507 |
62786 |
683 |
1.09 |
 |
|
| |
| . |
. |
Voting Results by location of ward electoral commission. |
. |
. |
| . |
. |
| . |
. |
. |
. |
. |
. |
. |
. |
. |
. |
. |
. |
. |
| No. |
Name |
No. of entitled
to vote |
No. of ballot
papers issued |
No. of votes |
No. of votes: per list / valid [%] |
| total |
valid |
per List |
| 1 | City | 89839 | 47957 | 47894 | 46714 | 435 | 0.93 | |
| 2 | Country | 42844 | 16664 | 16613 | 16072 | 248 | 1.54 | |
| . |
Voting Results by number of inhabitants of commune |
. |
| 1 | to 5 000 | 3560 | 1381 | 1380 | 1343 | 25 | 1.86 | |
| 2 | from 5 001 to 10 000 | 11070 | 4251 | 4241 | 4091 | 82 | 2.00 | |
| 3 | from 10 001 to 20 000 | 38914 | 17089 | 17050 | 16525 | 217 | 1.31 | |
| 4 | from 20 001 to 50 000 | 15954 | 6863 | 6861 | 6610 | 80 | 1.21 | |
| 5 | from 50 001 to 100 000 | 63185 | 35037 | 34975 | 34217 | 279 | 0.82 | |
| 6 | from 100 001 to 200 000 | 0 | 0 | 0 | 0 | 0 | 0.00 | |
| 7 | from 200 001 to 500 000 | 0 | 0 | 0 | 0 | 0 | 0.00 | |
| 8 | over 500 000 | 0 | 0 | 0 | 0 | 0 | 0.00 | |
|
|


 Legal Acts
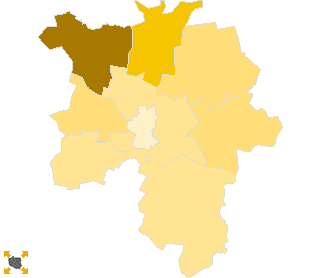
 Legal Acts