|
See also:
|
| . |
. |
Voting Results for Committee. |
. |
. |
| . |
. |
| . |
. |
. |
. |
. |
. |
. |
. |
. |
. |
. |
. |
. |
| No. |
Name |
No. of entitled
to vote |
No. of ballot papers
issued |
No. of votes |
No. of votes: per list / valid [%] |
| total |
valid |
per List |
| 321402 | Chociwel, gm. | 4824 | 2066 | 2064 | 1995 | 23 | 1.15 |  |
| 321403 | Dobrzany, gm. | 4030 | 1644 | 1644 | 1585 | 33 | 2.08 | |
| 321404 | Dolice, gm. | 6250 | 2386 | 2386 | 2291 | 32 | 1.40 | |
| 321405 | Ińsko, gm. | 2962 | 1275 | 1273 | 1222 | 18 | 1.47 | |
| 321406 | Kobylanka, gm. | 2946 | 1621 | 1621 | 1589 | 15 | 0.94 | |
| 321408 | Marianowo, gm. | 2434 | 1061 | 1060 | 1010 | 10 | 0.99 | |
| 321409 | Stara Dąbrowa, gm. | 2770 | 978 | 978 | 947 | 17 | 1.80 | |
| 321410 | Stargard Szczeciński, gm. | 8822 | 3584 | 3584 | 3421 | 35 | 1.02 | |
| 321401 | Stargard Szczeciński, m. | 56711 | 32162 | 32118 | 31521 | 263 | 0.83 | |
| 321411 | Suchań, gm. | 3397 | 1254 | 1254 | 1200 | 19 | 1.58 | |
| |
stargardzki, pow. |
95146 |
48031 |
47982 |
46781 |
465 |
0.99 |
 |
|
| |
| . |
. |
Voting Results by location of ward electoral commission. |
. |
. |
| . |
. |
| . |
. |
. |
. |
. |
. |
. |
. |
. |
. |
. |
. |
. |
| No. |
Name |
No. of entitled
to vote |
No. of ballot
papers issued |
No. of votes |
No. of votes: per list / valid [%] |
| total |
valid |
per List |
| 1 | City | 64263 | 35838 | 35793 | 35060 | 314 | 0.90 | |
| 2 | Country | 30883 | 12193 | 12189 | 11721 | 151 | 1.29 | |
| . |
Voting Results by number of inhabitants of commune |
. |
| 1 | to 5 000 | 14509 | 6189 | 6186 | 5968 | 79 | 1.32 | |
| 2 | from 5 001 to 10 000 | 15104 | 6096 | 6094 | 5871 | 88 | 1.50 | |
| 3 | from 10 001 to 20 000 | 8822 | 3584 | 3584 | 3421 | 35 | 1.02 | |
| 4 | from 20 001 to 50 000 | 0 | 0 | 0 | 0 | 0 | 0.00 | |
| 5 | from 50 001 to 100 000 | 56711 | 32162 | 32118 | 31521 | 263 | 0.83 | |
| 6 | from 100 001 to 200 000 | 0 | 0 | 0 | 0 | 0 | 0.00 | |
| 7 | from 200 001 to 500 000 | 0 | 0 | 0 | 0 | 0 | 0.00 | |
| 8 | over 500 000 | 0 | 0 | 0 | 0 | 0 | 0.00 | |
|
|


 Legal Acts
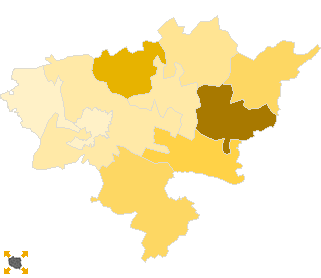
 Legal Acts