.
.
 
. .
Voting Results
.
. . Voting Results for Committee . .
. .
. . . . . . . . . . . . . . . .
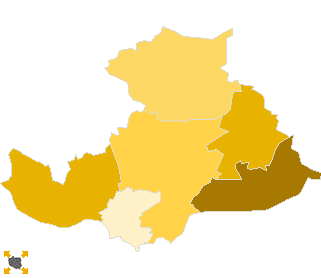
Polska / Lublin / rycki, pow. ...
Komitet Wyborczy Samoobrona Rzeczpospolitej Polskiej
List's Number: 15
No. of valid votes: 23872
No. of votes per List: 951
3.98%
lack1.39%2.04%2.69%3.34%3.99%4.64%5.29%5.94%6.59%7.24%not
of data2.03%2.68%3.33%3.98%4.63%5.28%5.93%6.58%7.23%7.89%applicable

See also:
. . Voting Results for Committee. . .
. .
. . . . . . . . . . . . .
No. Name No. of entitled
to vote
No. of ballot papers
issued
No. of votes No. of votes: per list / valid [%]
total valid per List
061601Dęblin, m.144237772777275861061.40
061602Kłoczew, gm.58922781278126861114.13
061603Nowodwór, gm.3287151915191492916.10
061604Ryki, gm.169148749874185844054.72
061605Stężyca, gm.44942203219421411296.03
061606Ułęż, gm.29301433143313831097.88
  rycki, pow. 47940 24457 24440 23872 951 3.98

. . Voting Results for Candidates . .
. .
. . . . . . . . . . .
No. Surname Names No. of votes % No. of votes per candidate/No. per list % No. of votes per candidate/No. of valid votes
1BORYSIUK Bolesław Borys14715.450.62
2KRZYSZCZAK Józef171.780.07
3WINNICKI Ryszard60.630.03
4GUT Violetta Małgorzata555.780.23
5SZYMAŃSKI Zygmunt Jerzy58561.512.45
6MARZEC Wiesław40.420.02
7MAŁEK Urszula Elżbieta90.940.04
8SIENKIEWICZ Dariusz141.470.06
9RYMARZ Stanisław Kazimierz20.210.01
10KOPEĆ Tadeusz Stefan60.630.03
11WOŹNIAK Jan101.050.04
12WAWER Maria Józefa60.630.03
13SIEMBIDA Janusz Edward30.310.01
14KOWAL Jan70.730.03
15EYSMONT Przemysław30.310.01
16BOCHEN Piotr Bartłomiej20.210.01
17PIŁAT Albert Konrad30.310.01
18KASAK-KULIKOWSKA Elżbieta50.520.02
19DĄBSKI Leszek10.100.00 
20MIROSŁAW Zbigniew40.420.02
21DANIELEWICZ Marian20.210.01
22ZAKRZEWSKI Ryszard Andrzej50.520.02
23FRONC Justyna20.210.01
24MAZUREK Kazimierz50.520.02
25GORAL Andrzej Leszek10.100.00 
26FILIPEK Kazimierz474.940.20
Σ   951 100.00 3.98
 
. . Voting Results by location of ward electoral commission. . .
. .
. . . . . . . . . . . . .
No. Name No. of entitled
to vote
No. of ballot
papers issued
No. of votes No. of votes: per list / valid [%]
total valid per List
1City228051249012489122302592.12
2Country251351196711951116426925.94
. Voting Results by number of inhabitants of commune .
1to 5 00062172952295228752006.96
2from 5 001 to 10 000103864984497548272404.97
3from 10 001 to 20 000144237772777275861061.40
4from 20 001 to 50 000169148749874185844054.72
5from 50 001 to 100 000000000.00 
6from 100 001 to 200 000000000.00 
7from 200 001 to 500 000000000.00 
8over 500 000000000.00 

  Legal Acts Documents Electoral Bodies Election Committees and Candidates Turnout Results Statistical Data SENATE Created by
 top