|
See also:
|
| . |
. |
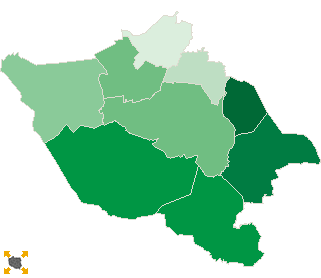
Number of people entitled to vote, number of ballot papers issued |
. |
. |
| . |
. |
| . |
. |
. |
. |
. |
. |
. |
. |
. |
. |
. |
. |
| No. |
Name |
No. of polling |
No. of people
entitled to vote |
No. of
ballot papers
issued |
No. of ballot papers issued / No. of people entitled to vote [%] |
| wards |
wards which
transmitted the results |
| 241505 | Godów, gm. | 8 | 8 | 10057 | 1154 | 11.47 |  |
| 241506 | Gorzyce, gm. | 14 | 14 | 15724 | 1777 | 11.30 | |
| 241507 | Lubomia, gm. | 8 | 8 | 6450 | 583 | 9.04 | |
| 241508 | Marklowice, gm. | 3 | 3 | 4154 | 548 | 13.19 | |
| 241509 | Mszana, gm. | 4 | 4 | 5473 | 661 | 12.08 | |
| 241501 | Pszów, m. | 5 | 5 | 11478 | 1099 | 9.57 | |
| 241502 | Radlin, m. | 8 | 8 | 14244 | 1071 | 7.52 | |
| 241503 | Rydułtowy, m. | 14 | 14 | 17757 | 1156 | 6.51 | |
| 241504 | Wodzisław Śląski, m. | 29 | 29 | 39402 | 3876 | 9.84 | |
| |
wodzisławski, pow. |
93 |
93 |
124739 |
11925 |
9.56 |
 |
|
| |
| . |
. |
Turnout by location of ward electoral commission |
. |
. |
| . |
. |
| . |
. |
. |
. |
. |
. |
. |
. |
. |
. |
. |
. |
| No. |
Name |
No. of polling |
No. of people
entitled to vote |
No. of
ballot papers
issued |
No. of ballot papers issued / No. of people entitled to vote [%] |
| wards |
wards which
transmitted the results |
| 1 | rural commune | 37 | 37 | 41858 | 4723 | 11.28 | |
| 2 | urban commune | 56 | 56 | 82881 | 7202 | 8.69 | |
|
|


 Legal Acts

 Legal Acts