|
See also:
|
| . |
. |
Number of people entitled to vote, number of ballot papers issued |
. |
. |
| . |
. |
| . |
. |
. |
. |
. |
. |
. |
. |
. |
. |
. |
. |
| No. |
Name |
No. of polling |
No. of people
entitled to vote |
No. of
ballot papers
issued |
No. of ballot papers issued / No. of people entitled to vote [%] |
| wards |
wards which
transmitted the results |
| 120502 | Biecz, gm. | 13 | 13 | 13345 | 1728 | 12.95 |  |
| 120503 | Bobowa, gm. | 7 | 7 | 6732 | 1202 | 17.86 | |
| 120504 | Gorlice, gm. | 11 | 11 | 12690 | 2052 | 16.17 | |
| 120501 | Gorlice, m. | 22 | 22 | 24122 | 2798 | 11.60 | |
| 120505 | Lipinki, gm. | 7 | 7 | 5367 | 718 | 13.38 | |
| 120506 | Łużna, gm. | 7 | 7 | 6264 | 1066 | 17.02 | |
| 120507 | Moszczenica, gm. | 3 | 3 | 3669 | 562 | 15.32 | |
| 120508 | Ropa, gm. | 4 | 4 | 3738 | 732 | 19.58 | |
| 120509 | Sękowa, gm. | 6 | 6 | 3746 | 441 | 11.77 | |
| 120510 | Uście Gorlickie, gm. | 10 | 10 | 4838 | 532 | 11.00 | |
| |
gorlicki, pow. |
90 |
90 |
84511 |
11831 |
14.00 |
 |
|
| |
| . |
. |
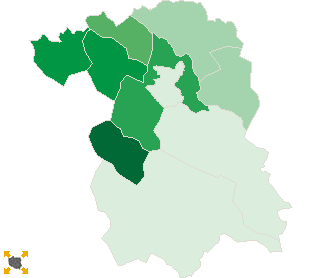
Turnout by location of ward electoral commission |
. |
. |
| . |
. |
| . |
. |
. |
. |
. |
. |
. |
. |
. |
. |
. |
. |
| No. |
Name |
No. of polling |
No. of people
entitled to vote |
No. of
ballot papers
issued |
No. of ballot papers issued / No. of people entitled to vote [%] |
| wards |
wards which
transmitted the results |
| 1 | rural commune | 55 | 55 | 47044 | 7305 | 15.53 | |
| 2 | urban - rural commune | 13 | 13 | 13345 | 1728 | 12.95 | |
| 3 | urban commune | 22 | 22 | 24122 | 2798 | 11.60 | |
|
|


 Legal Acts

 Legal Acts