|
See also:
|
| . |
. |
Number of people entitled to vote, number of ballot papers issued |
. |
. |
| . |
. |
| . |
. |
. |
. |
. |
. |
. |
. |
. |
. |
. |
. |
| No. |
Name |
No. of polling |
No. of people
entitled to vote |
No. of
ballot papers
issued |
No. of ballot papers issued / No. of people entitled to vote [%] |
| wards |
wards which
transmitted the results |
| 062001 | Adamów, gm. | 5 | 5 | 3963 | 310 | 7.82 |  |
| 062002 | Grabowiec, gm. | 4 | 4 | 3766 | 316 | 8.39 | |
| 062003 | Komarów-Osada, gm. | 7 | 7 | 4446 | 436 | 9.81 | |
| 062004 | Krasnobród, gm. | 10 | 10 | 5684 | 532 | 9.36 | |
| 062005 | Łabunie, gm. | 6 | 6 | 4842 | 384 | 7.93 | |
| 062006 | Miączyn, gm. | 8 | 8 | 4933 | 365 | 7.40 | |
| 062007 | Nielisz, gm. | 7 | 7 | 4902 | 226 | 4.61 | |
| 062008 | Radecznica, gm. | 7 | 7 | 5435 | 353 | 6.49 | |
| 062009 | Sitno, gm. | 6 | 6 | 5445 | 527 | 9.68 | |
| 062010 | Skierbieszów, gm. | 6 | 6 | 4541 | 428 | 9.43 | |
| 062011 | Stary Zamość, gm. | 6 | 6 | 4329 | 332 | 7.67 | |
| 062012 | Sułów, gm. | 6 | 6 | 4168 | 263 | 6.31 | |
| 062013 | Szczebrzeszyn, gm. | 9 | 9 | 9642 | 740 | 7.67 | |
| 062014 | Zamość, gm. | 18 | 18 | 16126 | 1222 | 7.58 | |
| 062015 | Zwierzyniec, gm. | 5 | 5 | 5746 | 285 | 4.96 | |
| |
zamojski, pow. |
110 |
110 |
87968 |
6719 |
7.64 |
 |
|
| |
| . |
. |
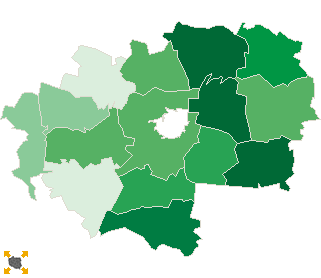
Turnout by location of ward electoral commission |
. |
. |
| . |
. |
| . |
. |
. |
. |
. |
. |
. |
. |
. |
. |
. |
. |
| No. |
Name |
No. of polling |
No. of people
entitled to vote |
No. of
ballot papers
issued |
No. of ballot papers issued / No. of people entitled to vote [%] |
| wards |
wards which
transmitted the results |
| 1 | rural commune | 86 | 86 | 66896 | 5162 | 7.72 | |
| 2 | urban - rural commune | 24 | 24 | 21072 | 1557 | 7.39 | |
|
|


 Legal Acts

 Legal Acts