|
See also:
|
| . |
. |
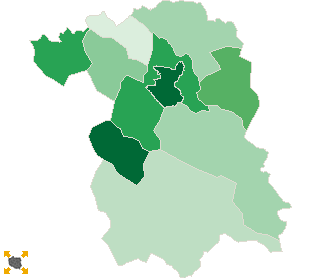
Voting results |
. |
. |
| . |
. |
| . |
. |
. |
. |
. |
. |
. |
. |
. |
. |
. |
. |
| No. |
Name |
No. entitled
to vote |
No. of ballot
papers issued |
No. of |
No. of ballot papers issued / No. entitled to vote
[%] |
| total votes |
valid votes |
| 120502 | Biecz, gm. | 13385 | 5868 | 5866 | 5758 | 43.84 |  |
| 120503 | Bobowa, gm. | 6768 | 3314 | 3308 | 3245 | 48.97 | |
| 120504 | Gorlice, gm. | 12690 | 6200 | 6195 | 6059 | 48.86 | |
| 120501 | Gorlice, m. | 24184 | 12734 | 12717 | 12520 | 52.65 | |
| 120505 | Lipinki, gm. | 5374 | 2547 | 2546 | 2480 | 47.39 | |
| 120506 | Łużna, gm. | 6270 | 2837 | 2836 | 2750 | 45.25 | |
| 120507 | Moszczenica, gm. | 3676 | 1511 | 1511 | 1478 | 41.10 | |
| 120508 | Ropa, gm. | 3754 | 1947 | 1947 | 1914 | 51.86 | |
| 120509 | Sękowa, gm. | 3761 | 1676 | 1676 | 1655 | 44.56 | |
| 120510 | Uście Gorlickie, gm. | 4917 | 2121 | 2121 | 2074 | 43.14 | |
| |
gorlicki, pow. |
84779 |
40755 |
40723 |
39933 |
48.07 |
 |
|
| |
| . |
. |
Turnout by location of ward electoral commission |
. |
. |
| . |
. |
| . |
. |
. |
. |
. |
. |
. |
. |
. |
. |
. |
. |
| No. |
Name |
No. entitled
to vote |
No. of ballot
papers issued |
No. of |
No. of ballot papers issued / No. entitled to vote
[%] |
| total votes |
valid votes |
| 1 | City | 28001 | 14572 | 14553 | 14327 | 52.04 | |
| 2 | Country | 56778 | 26183 | 26170 | 25606 | 46.11 | |
| . |
Turnout by number of inhabitants of commune |
|
| 1 | to 5 000 | 7437 | 3187 | 3187 | 3133 | 42.85 | |
| 2 | from 5 001 to 10 000 | 27083 | 12766 | 12758 | 12463 | 47.14 | |
| 3 | from 10 001 to 20 000 | 26075 | 12068 | 12061 | 11817 | 46.28 | |
| 4 | from 20 001 to 50 000 | 24184 | 12734 | 12717 | 12520 | 52.65 | |
| 5 | from 50 001 to 100 000 | 0 | 0 | 0 | 0 | 0.00 | |
| 6 | from 100 001 to 200 000 | 0 | 0 | 0 | 0 | 0.00 | |
| 7 | from 200 001 to 500 000 | 0 | 0 | 0 | 0 | 0.00 | |
| 8 | over 500 000 | 0 | 0 | 0 | 0 | 0.00 | |
|
|


 Legal Acts

 Legal Acts