|
See also:
|
| . |
. |
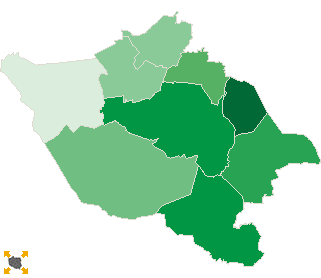
Voting results |
. |
. |
| . |
. |
| . |
. |
. |
. |
. |
. |
. |
. |
. |
. |
. |
. |
| No. |
Name |
No. entitled
to vote |
No. of ballot
papers issued |
No. of |
No. of ballot papers issued / No. entitled to vote
[%] |
| total votes |
valid votes |
| 241505 | Godów, gm. | 10068 | 5639 | 5636 | 5465 | 56.01 |  |
| 241506 | Gorzyce, gm. | 15742 | 8079 | 8074 | 7897 | 51.32 | |
| 241507 | Lubomia, gm. | 6466 | 2946 | 2941 | 2886 | 45.56 | |
| 241508 | Marklowice, gm. | 4154 | 2437 | 2436 | 2355 | 58.67 | |
| 241509 | Mszana, gm. | 5477 | 2942 | 2942 | 2859 | 53.72 | |
| 241501 | Pszów, m. | 11493 | 5696 | 5673 | 5574 | 49.56 | |
| 241502 | Radlin, m. | 14218 | 7500 | 7495 | 7379 | 52.75 | |
| 241503 | Rydułtowy, m. | 17749 | 8983 | 8971 | 8747 | 50.61 | |
| 241504 | Wodzisław Śląski, m. | 39470 | 22025 | 22009 | 21519 | 55.80 | |
| |
wodzisławski, pow. |
124837 |
66247 |
66177 |
64681 |
53.07 |
 |
|
| |
| . |
. |
Turnout by location of ward electoral commission |
. |
. |
| . |
. |
| . |
. |
. |
. |
. |
. |
. |
. |
. |
. |
. |
. |
| No. |
Name |
No. entitled
to vote |
No. of ballot
papers issued |
No. of |
No. of ballot papers issued / No. entitled to vote
[%] |
| total votes |
valid votes |
| 1 | City | 82930 | 44204 | 44148 | 43219 | 53.30 | |
| 2 | Country | 41907 | 22043 | 22029 | 21462 | 52.60 | |
| . |
Turnout by number of inhabitants of commune |
. |
| 1 | to 5 000 | 0 | 0 | 0 | 0 | 0.00 | |
| 2 | from 5 001 to 10 000 | 16097 | 8325 | 8319 | 8100 | 51.72 | |
| 3 | from 10 001 to 20 000 | 51521 | 26914 | 26878 | 26315 | 52.24 | |
| 4 | from 20 001 to 50 000 | 57219 | 31008 | 30980 | 30266 | 54.19 | |
| 5 | from 50 001 to 100 000 | 0 | 0 | 0 | 0 | 0.00 | |
| 6 | from 100 001 to 200 000 | 0 | 0 | 0 | 0 | 0.00 | |
| 7 | from 200 001 to 500 000 | 0 | 0 | 0 | 0 | 0.00 | |
| 8 | over 500 000 | 0 | 0 | 0 | 0 | 0.00 | |
|
|


 Legal Acts

 Legal Acts